Data insights

Bite-sized insights on how the world is changing, written by our team.

March 22, 2024Bastian Herre

Colonialism meant that for centuries, many territories and people were ruled from elsewhere
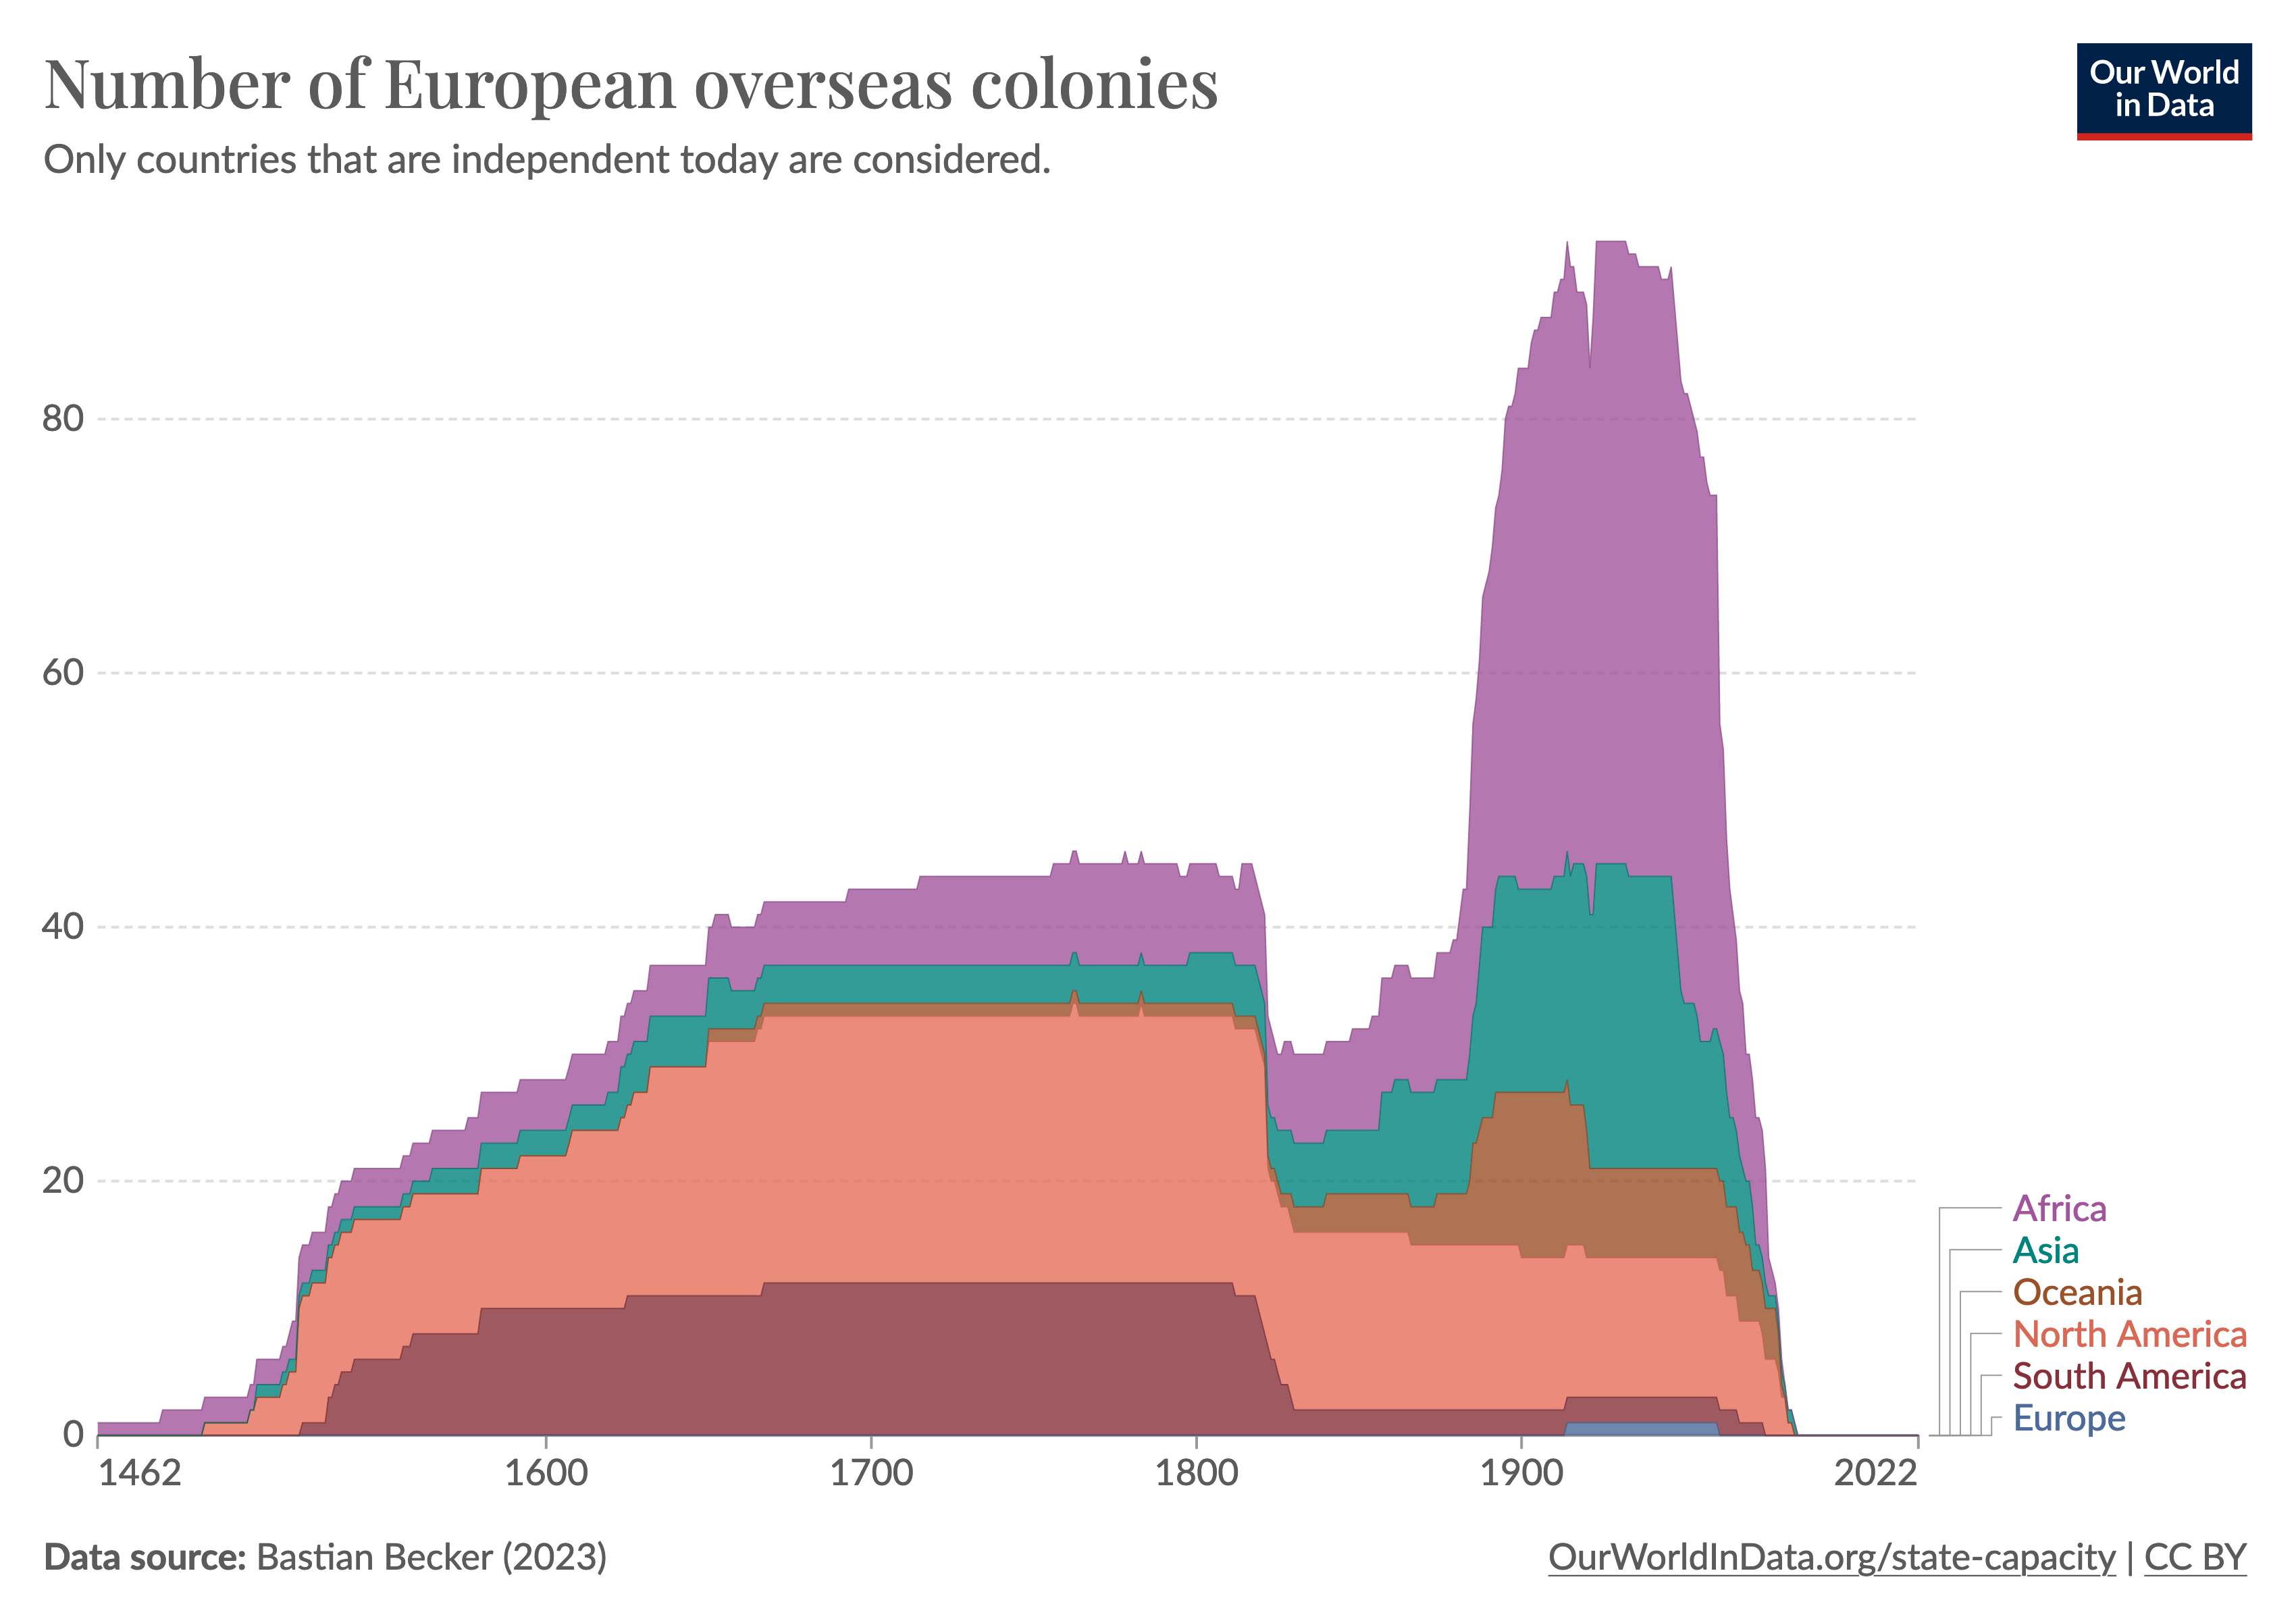
Stacked area chart of the number of European overseas colonies by region. The first wave last from the 15th century to the early 19th century and primarily affects the Americas. The second wave starts in the late 19th century, is concentrated in Africa and Asia, and ends in the mid-20th century.

Two hundred years ago, large parts of the world were ruled by a few European colonial powers, as the chart shows.

Since then, people in many countries have fought against colonial rule.

A first wave of countries gained independence in the 19th century, particularly in the Americas.

However, most countries did not gain independence until the middle of the 20th century.

Read more →

March 20, 2024Veronika Samborska

Plastic recycling rates are increasing, but slowly, in many regions
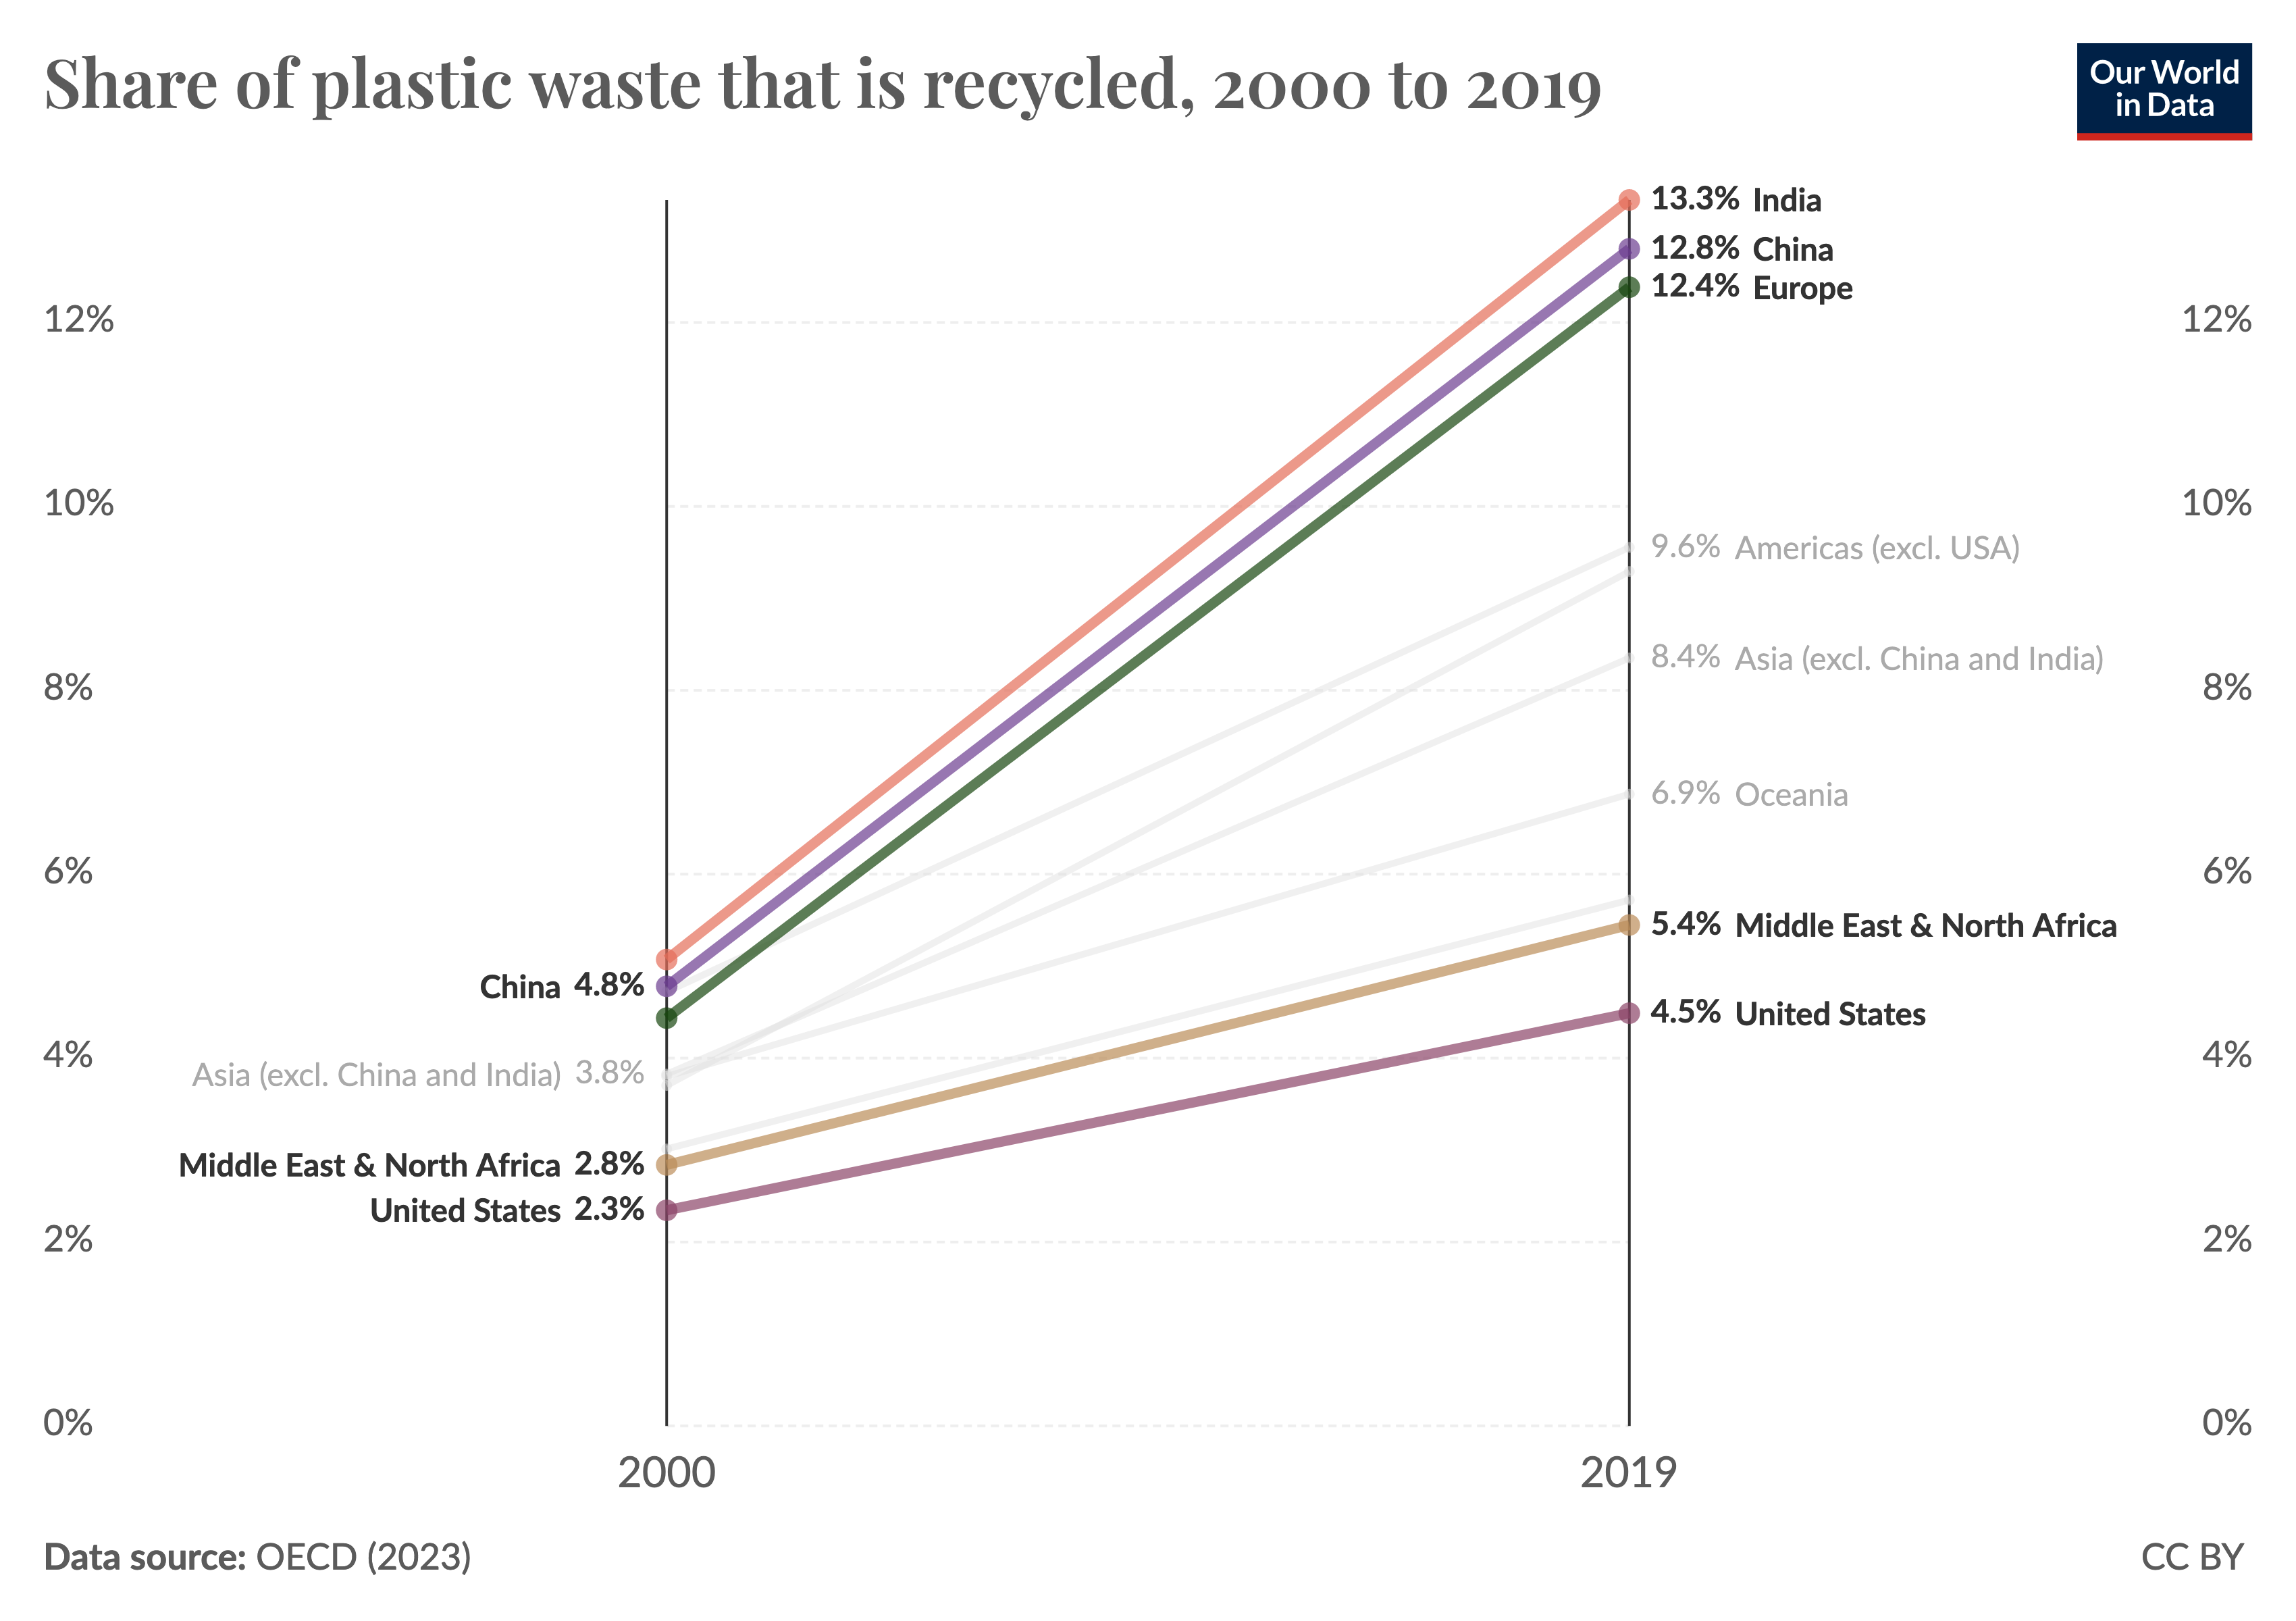
Plastic recycling rates are increasing, but slowly, in many regions

Over the last twenty years, plastic waste recycling has considerably increased worldwide, as the chart shows.

OECD countries in the European Union, India, and China have spearheaded this growth. By 2019, recycling rates were 12–13%. Non-OECD Asian countries and Latin America have also made headway, but more slowly.

The United States and the Middle East & North Africa region have seen more sluggish advances, with the US only managing to reach a 4.5% recycling rate by 2019, according to the OECD data.

Different regional strategies and capacities have led to markedly different outcomes in plastic waste management.

Explore the data →

March 18, 2024Saloni Dattani

The modal age at death has been rising
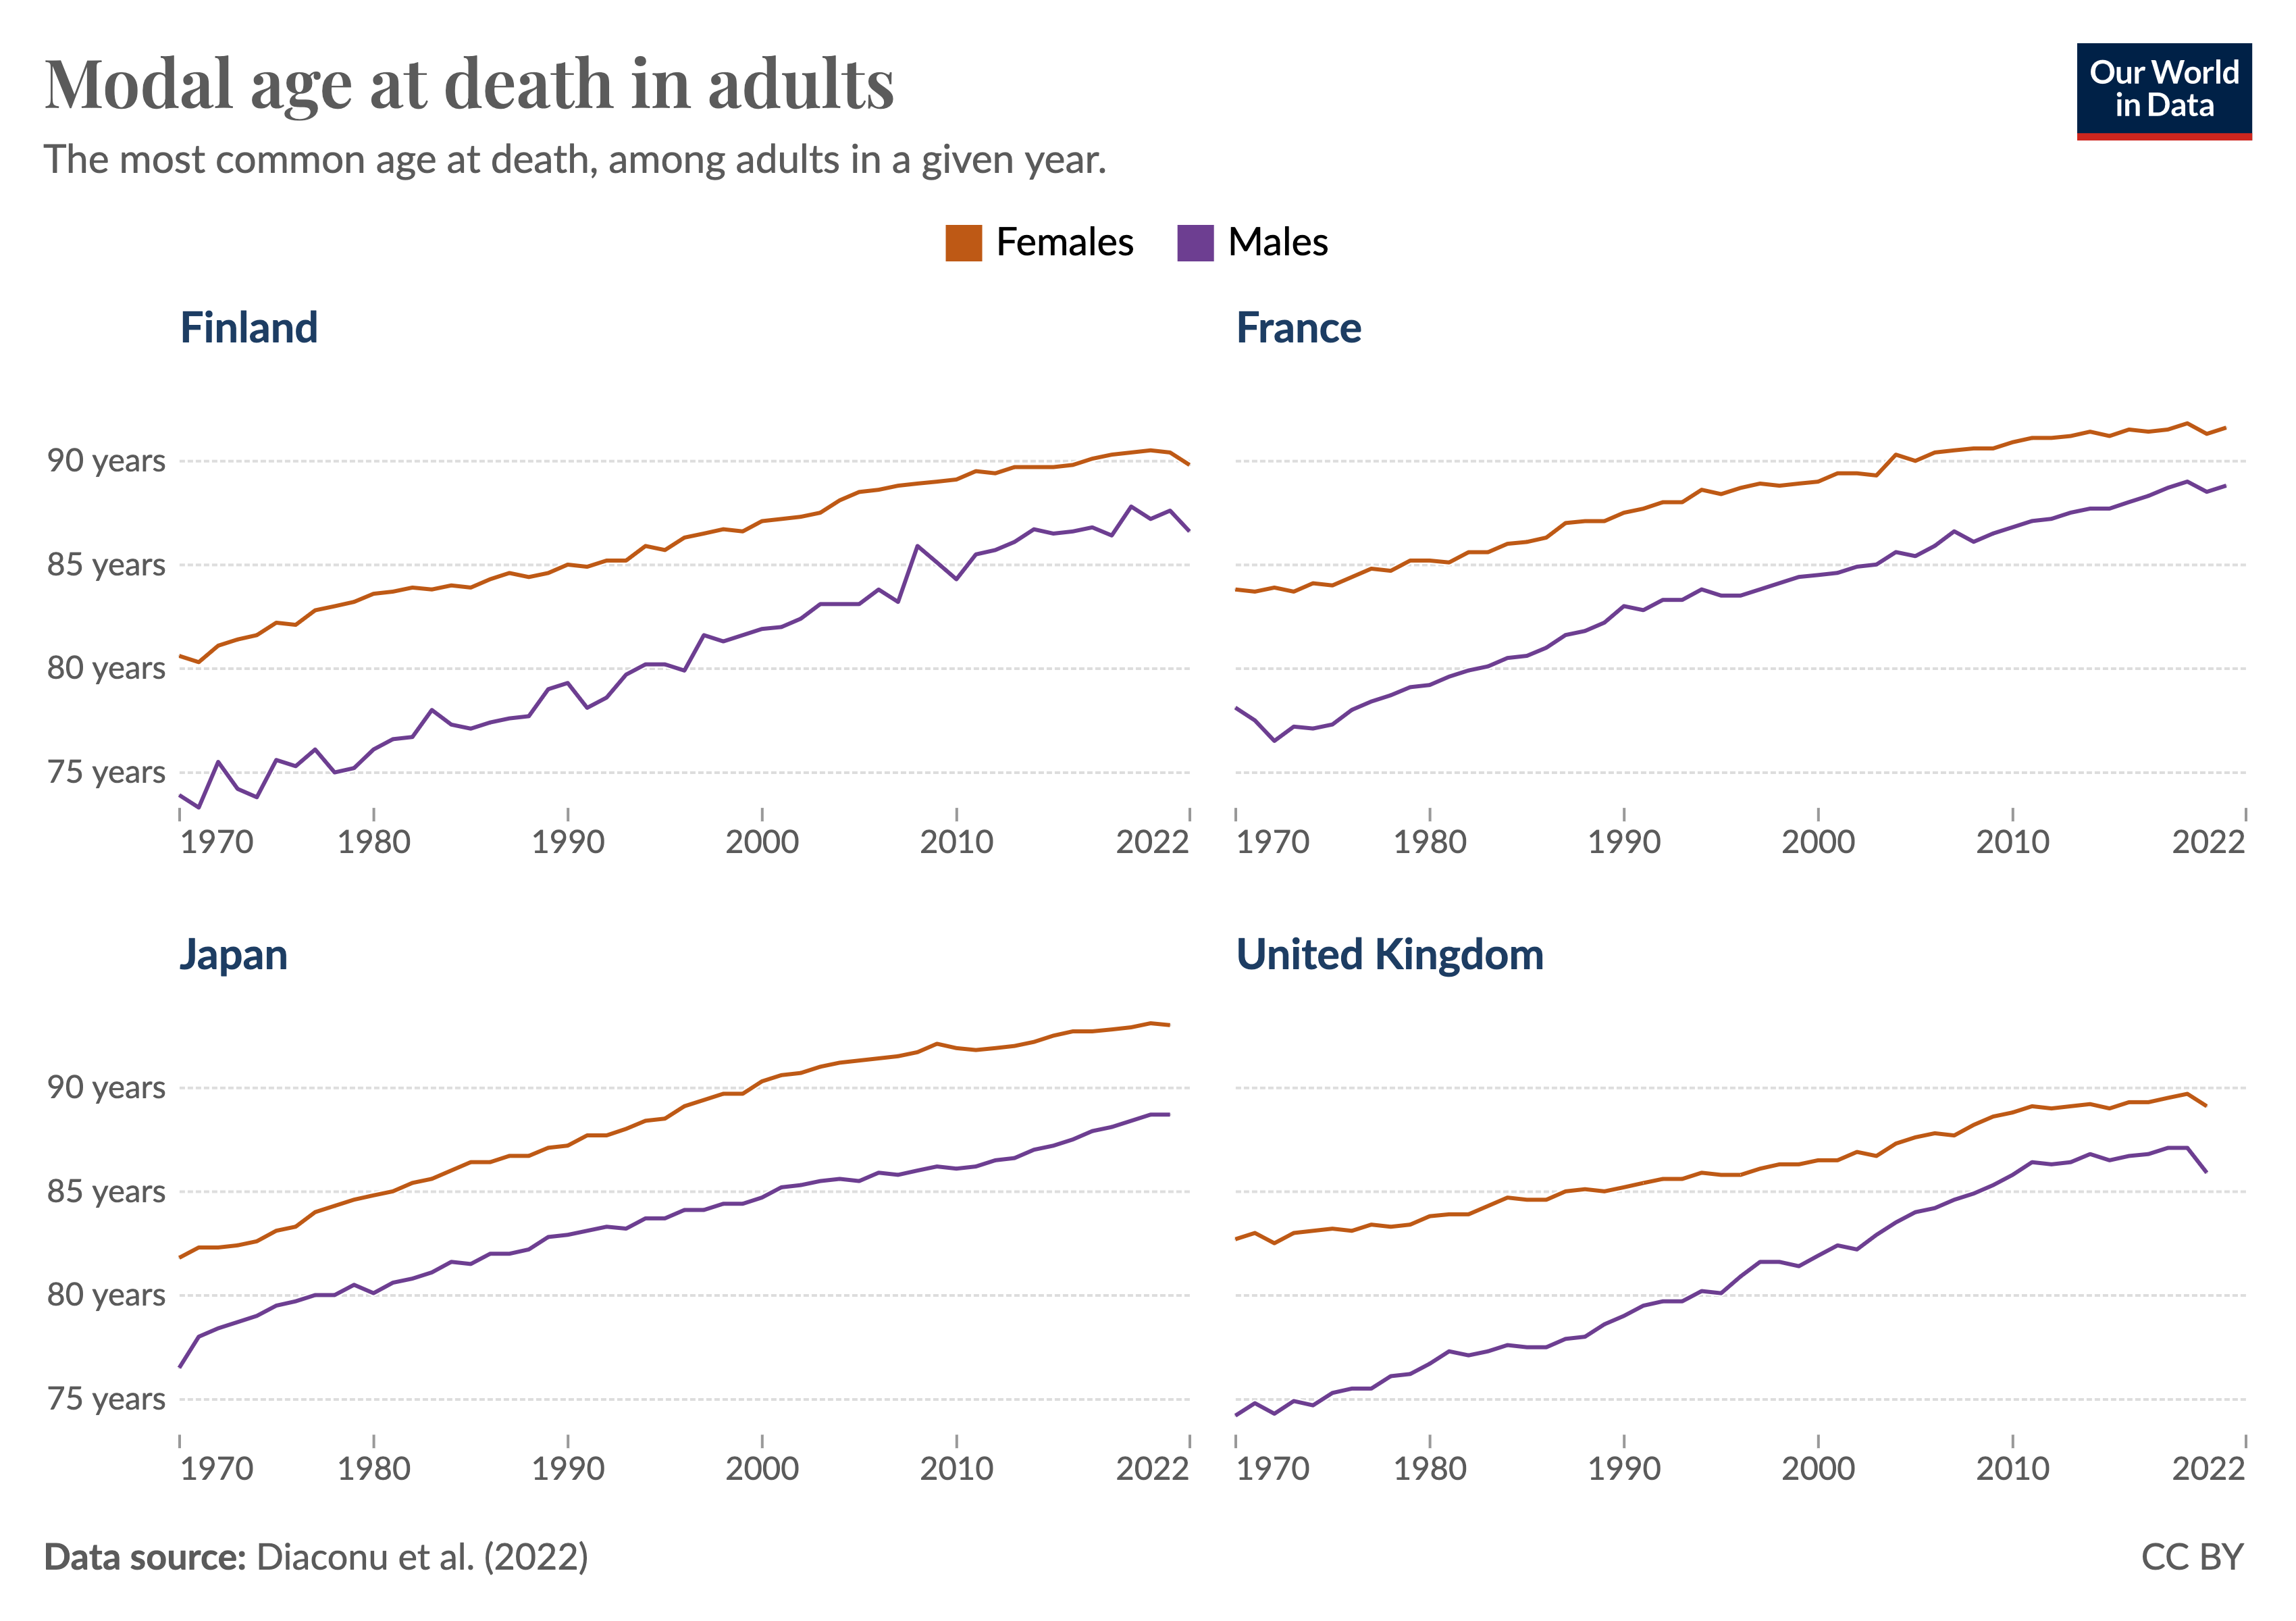
Line chart showing the 'adult modal age at death' in males and females in four countries (France, Finland, Japan and the United Kingdom). The chart shows a rise in the adult modal age at death since the 1970s.

The “modal age at death” is the most common age at which people in a population die. The modal age at death for women in Japan in 2021 was 93. In France, it was 92.

This metric helps us understand trends in longevity at older ages. Unlike life expectancy, it is not affected by infant or child mortality.

You can see that over time, the figure has been rising steadily. In France in 1970, the modal age at death was 84 years for women, but now it is 8 years higher.

Large gains in longevity have occurred even among the elderly.

Explore this data

March 15, 2024Fiona Spooner

Japan’s cherry trees have been blossoming earlier due to warmer spring temperatures
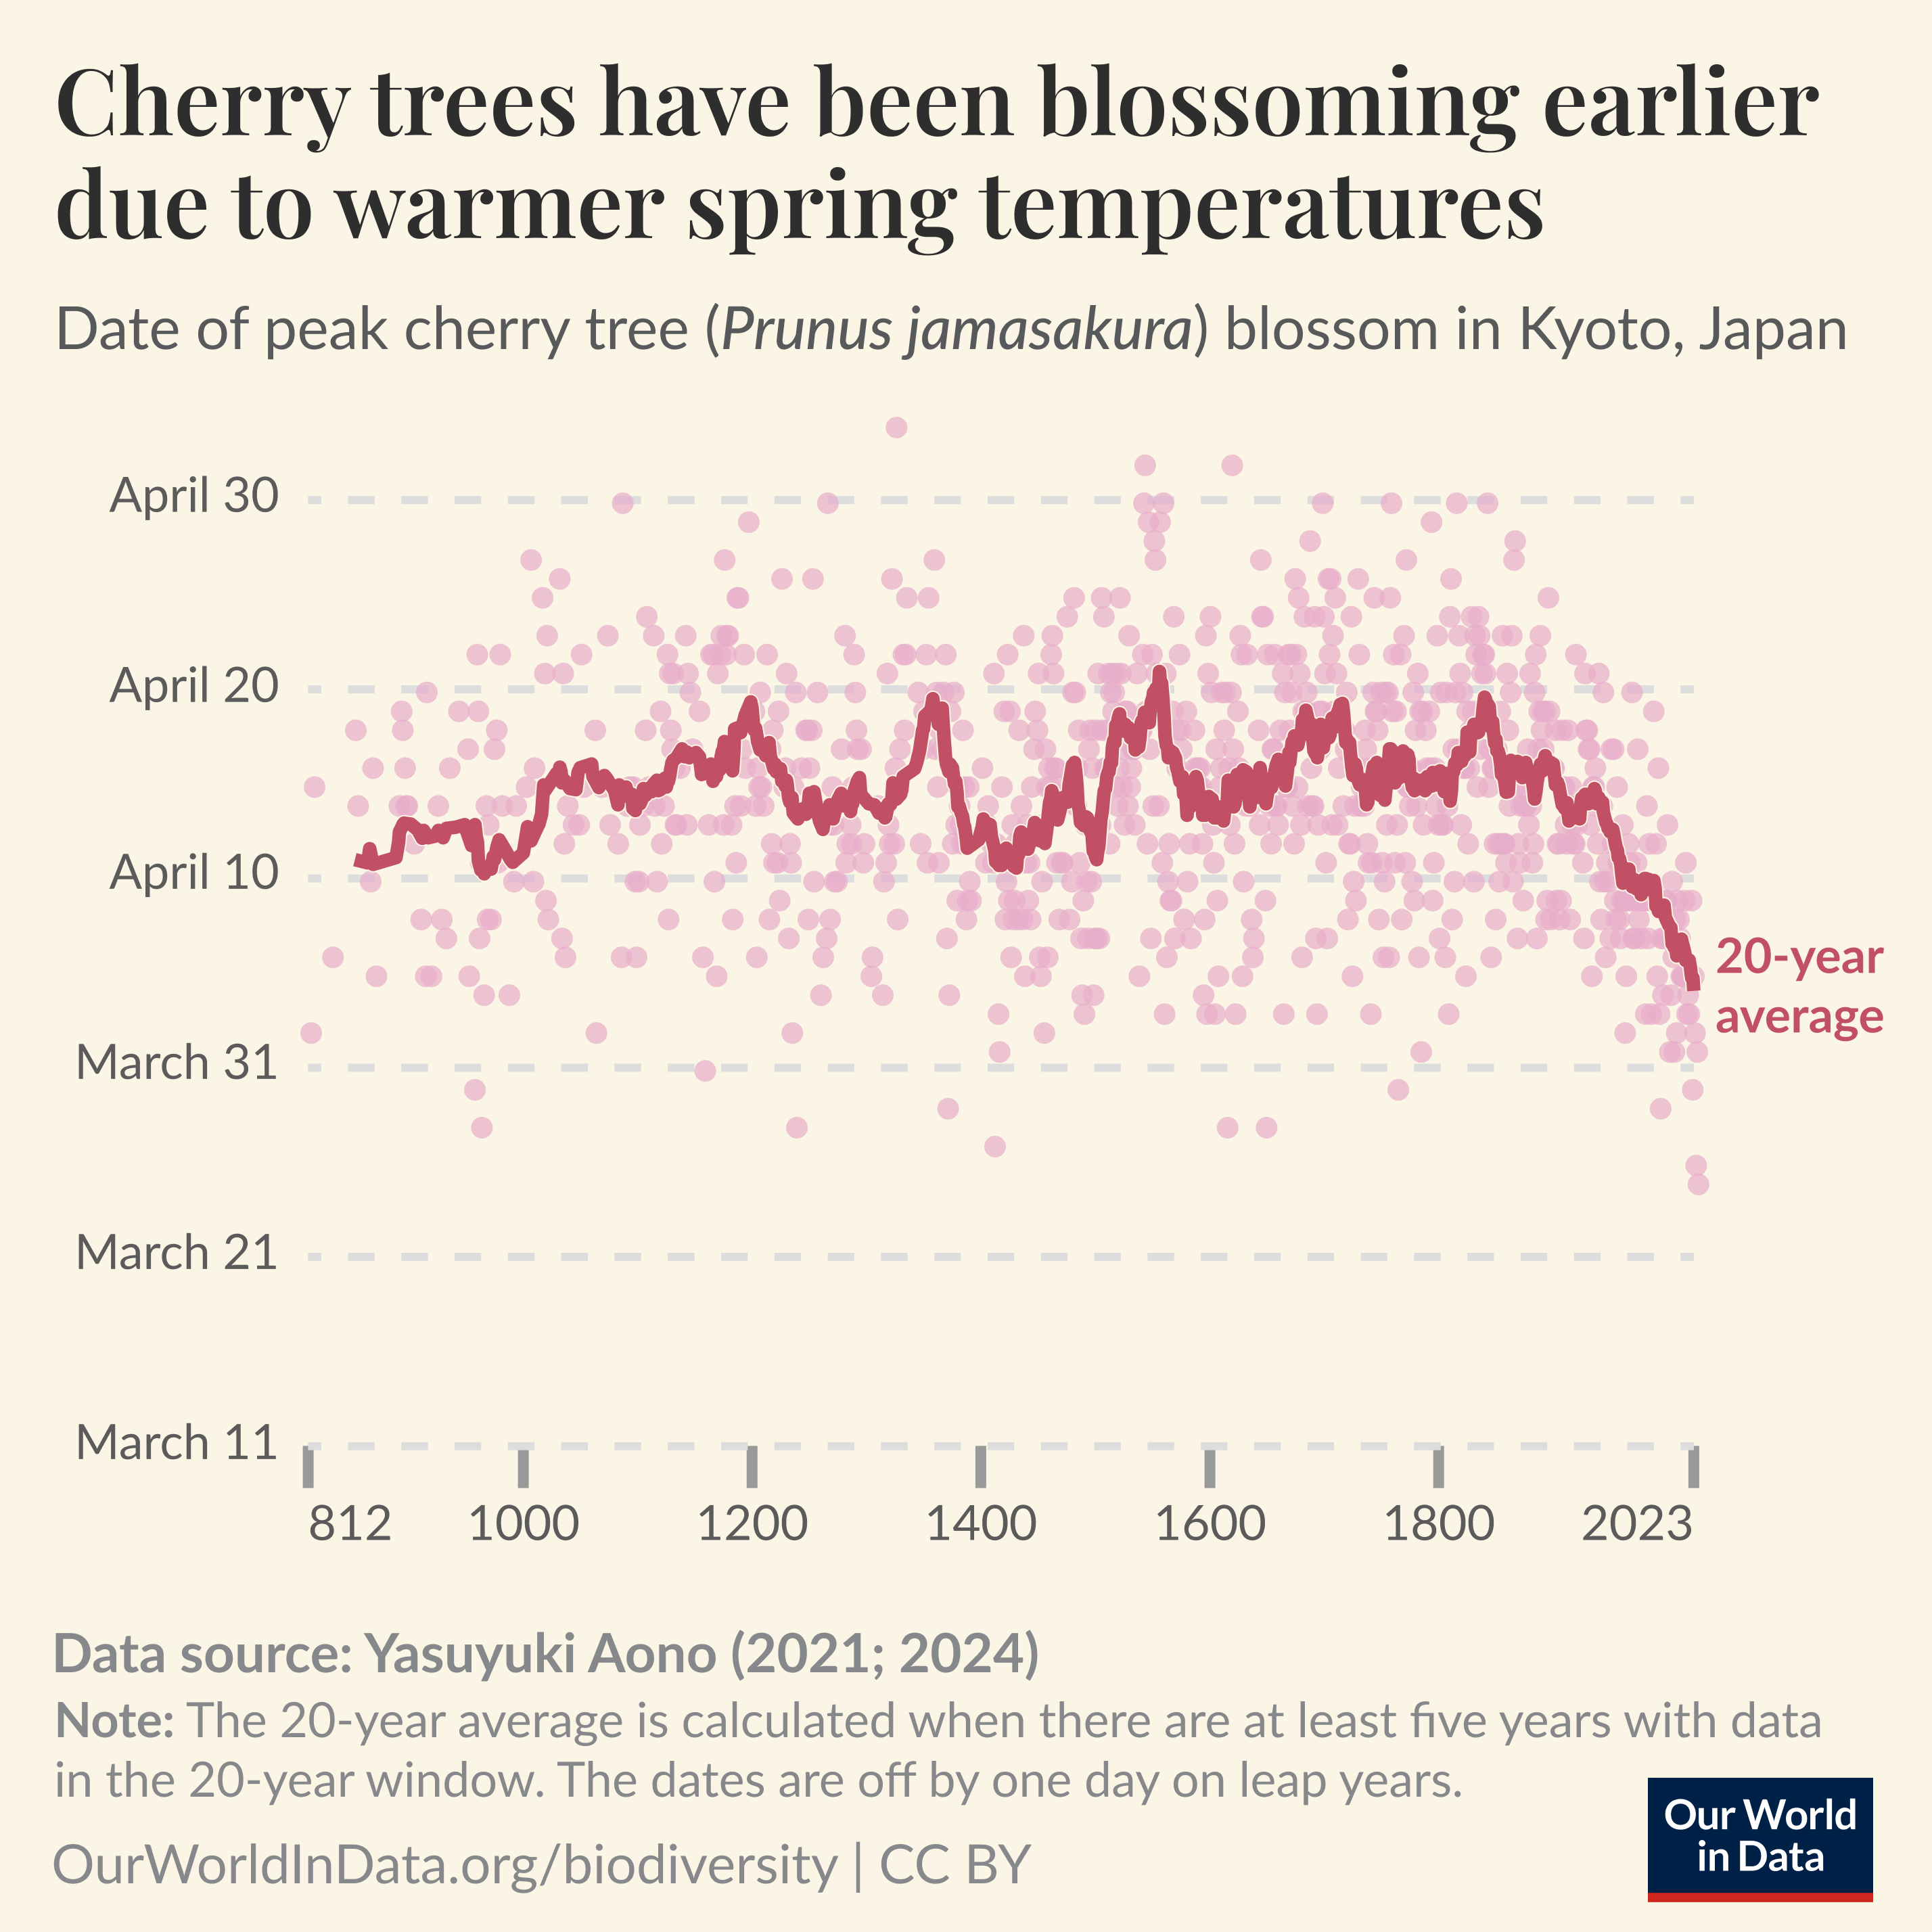
Japan’s cherry trees have been blossoming earlier due to warmer spring temperatures

The peak flowering of cherry trees in Kyoto, Japan, has been recorded since the ninth century. Yasuyuki Aono and colleagues from the Osaka Prefecture University collated this data from historical diaries and chronicles, indicating the dates on which cherry blossom viewing parties had been held or other observations of peak blossom.

In 2023, the peak cherry blossom happened on 25 March — the earliest date since recording began.

This long-run data is a proxy measure for how the climate has changed. The onset of the cherry blossom is linked with warmer temperatures. The combined effects of urbanization and higher temperatures due to climate change have caused the peak blossom to gradually move earlier in the year since the early 20th century.

Explore this data

March 13, 2024Max Roser

Declining child mortality, fast and slow
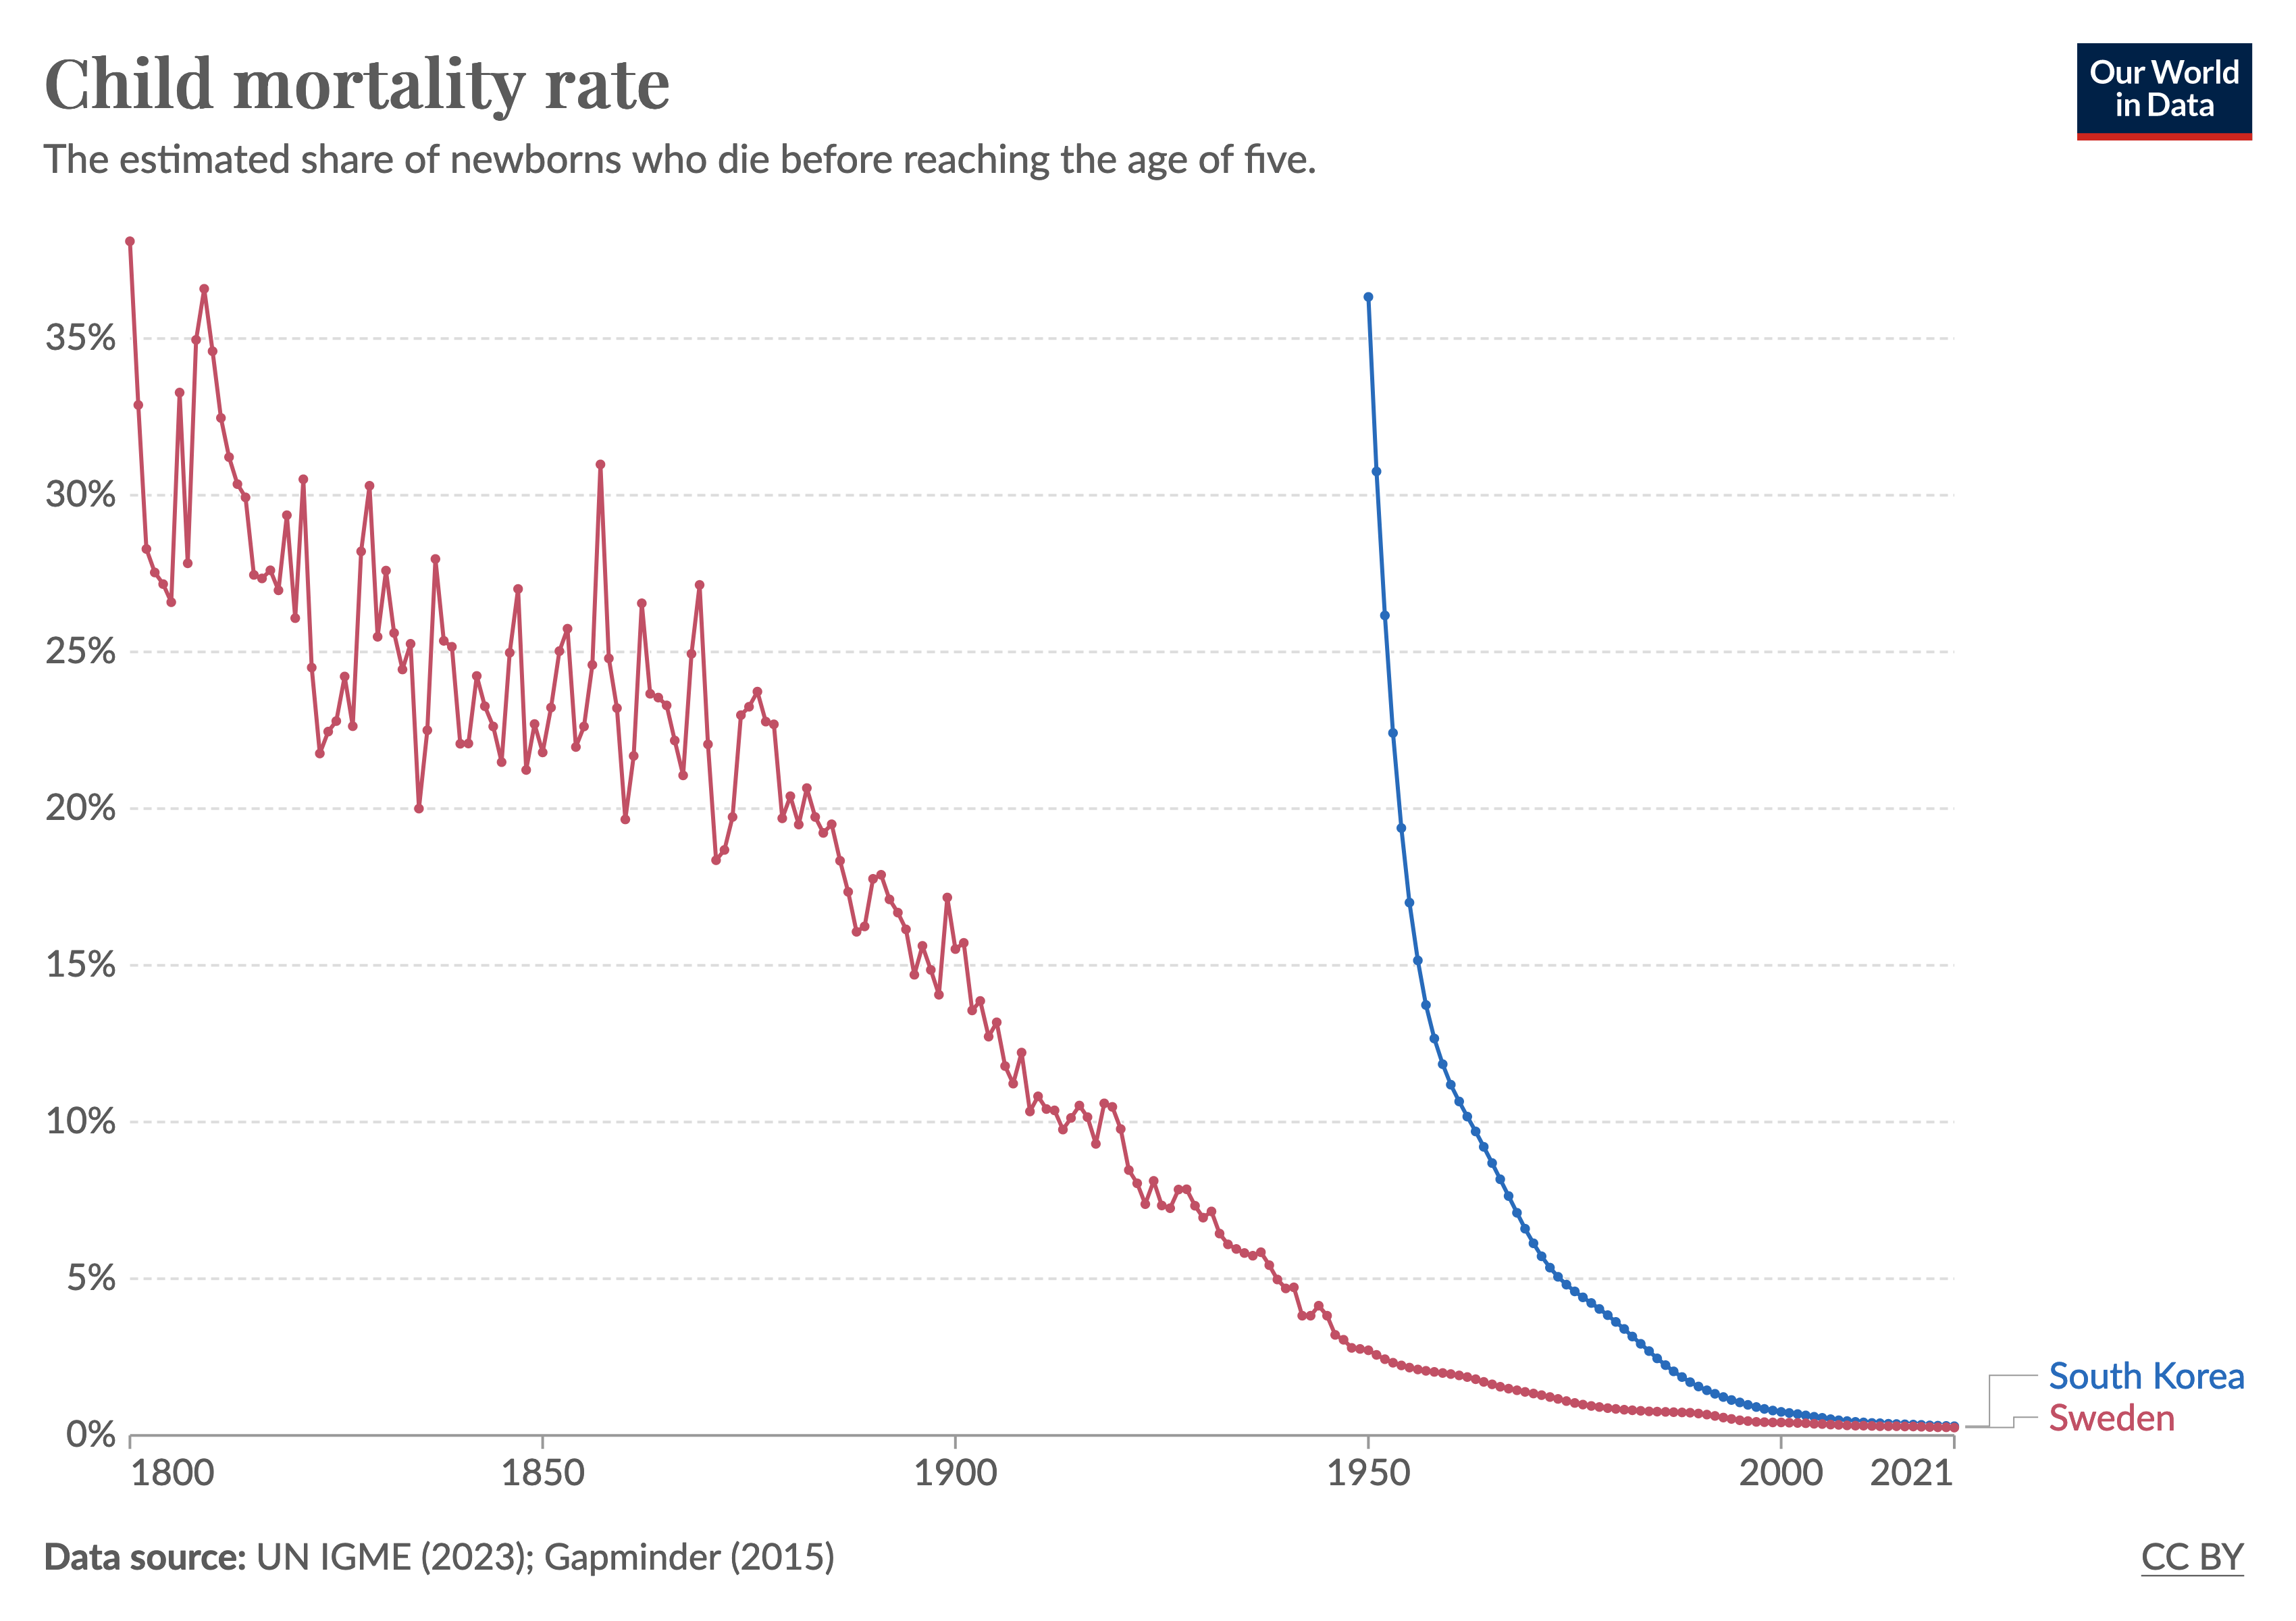
Declining child mortality, fast and slow

Two centuries ago, about one in three children in Sweden died before they were five years old, as you can see on the chart.

Since then, the child mortality rate in Sweden has declined to 0.2%.

South Korea achieved a similar reduction much faster. This is often the case: those countries that first achieve an improvement in living conditions often need much longer than some of those countries catching up later — countries that catch up can learn from what worked elsewhere.

Explore this data

March 11, 2024Edouard Mathieu

A record number of objects went into space in 2023

A record number of objects went into space in 2023

2,664 objects were launched into space in 2023. This figure breaks the record set the previous year.

The chart shows that US agencies and companies were responsible for launching 2,166 of these objects; that’s 81% of the global total.

Within American launches, 1,935 objects — 73% of the global total — belonged to Starlink, the constellation of satellites operated by the aerospace company SpaceX.

The rapid growth of the global satellite constellation has the power to help expand Internet connectivity, but also contributes to increasing concerns regarding space debris and the congestion of Earth’s orbital environment.

Explore this data

March 08, 2024Hannah Ritchie

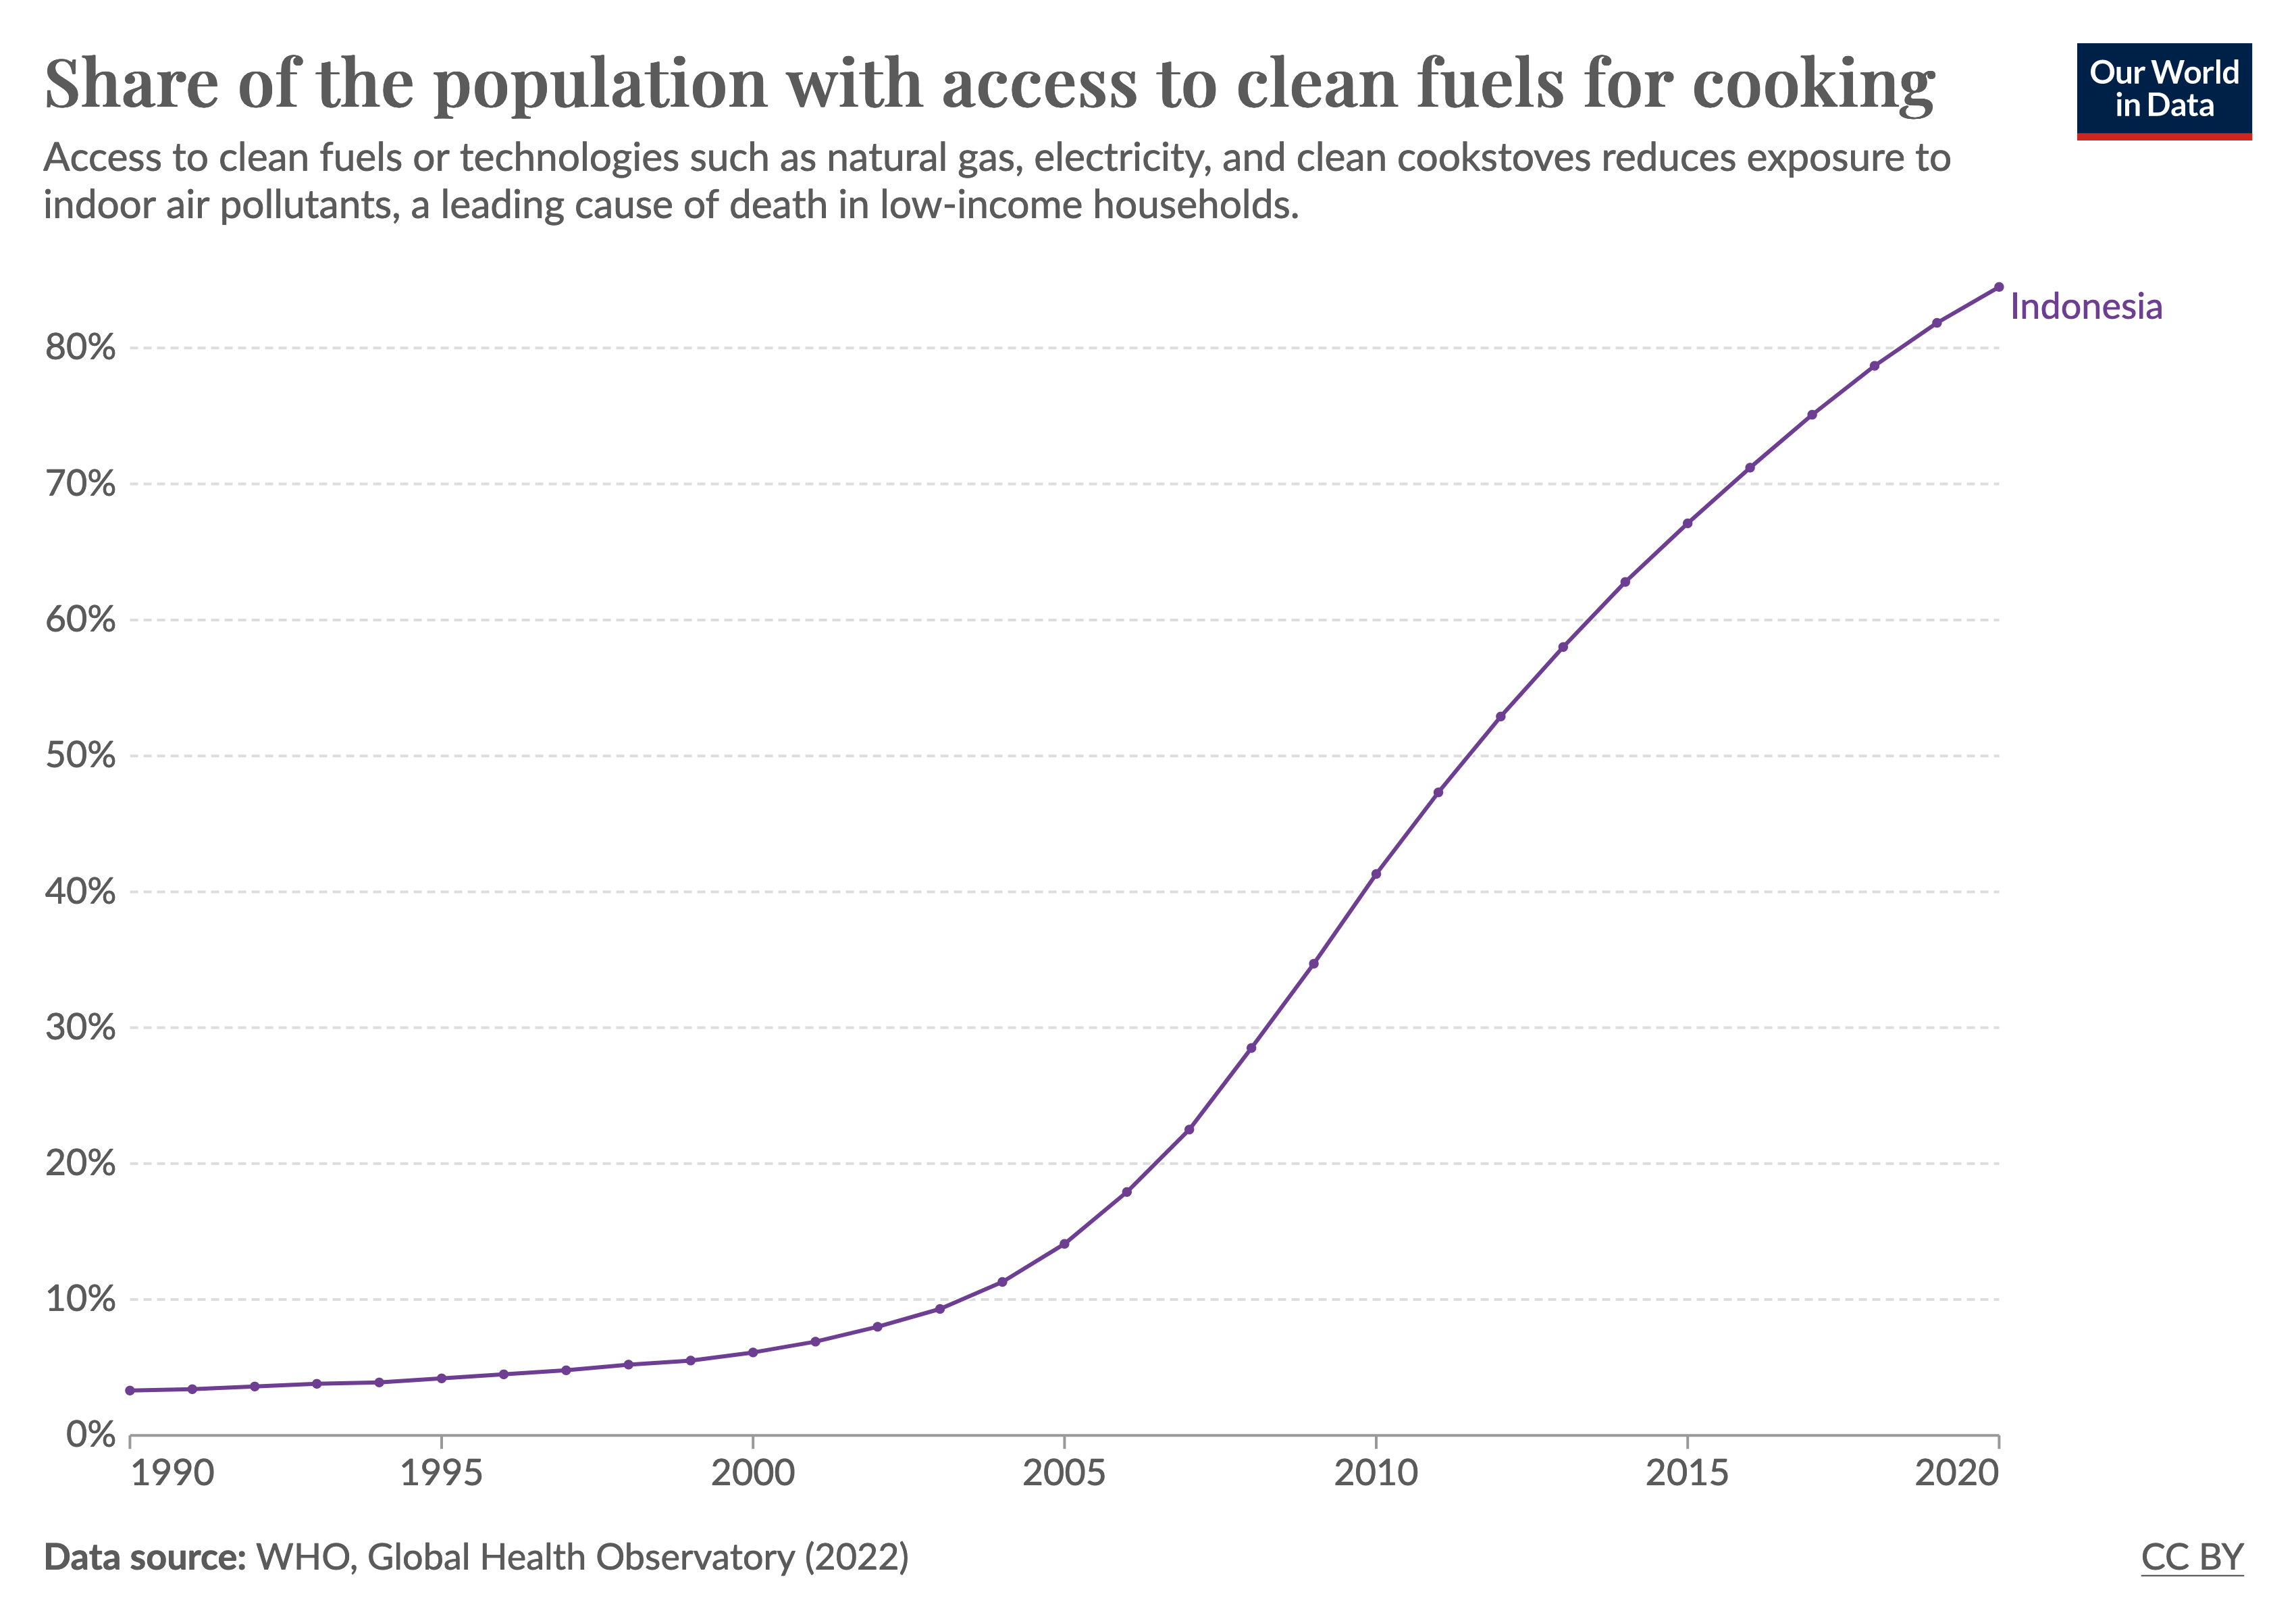
Indonesia’s shift to cleaner cooking fuels has greatly improved air quality and health

Indonesia’s shift to cleaner cooking fuels has greatly improved air quality and health

In 2000, less than 10% of the population in Indonesia had access to clean cooking fuels. This is now over 80%, as the chart shows.

Clean cooking fuels are those that, when burned, emit less than the World Health Organization's recommended amounts of air pollutants. They reduce the burden of air pollution — and its health impacts — for the households that use them.

In 2007, the Indonesian government launched a national program to move from kerosene cooking fuels to liquefied petroleum gas.

This shift has greatly reduced particulate pollution and improved health outcomes. Death rates from indoor air pollution have fallen steeply.

Explore this data

March 06, 2024Bastian Herre

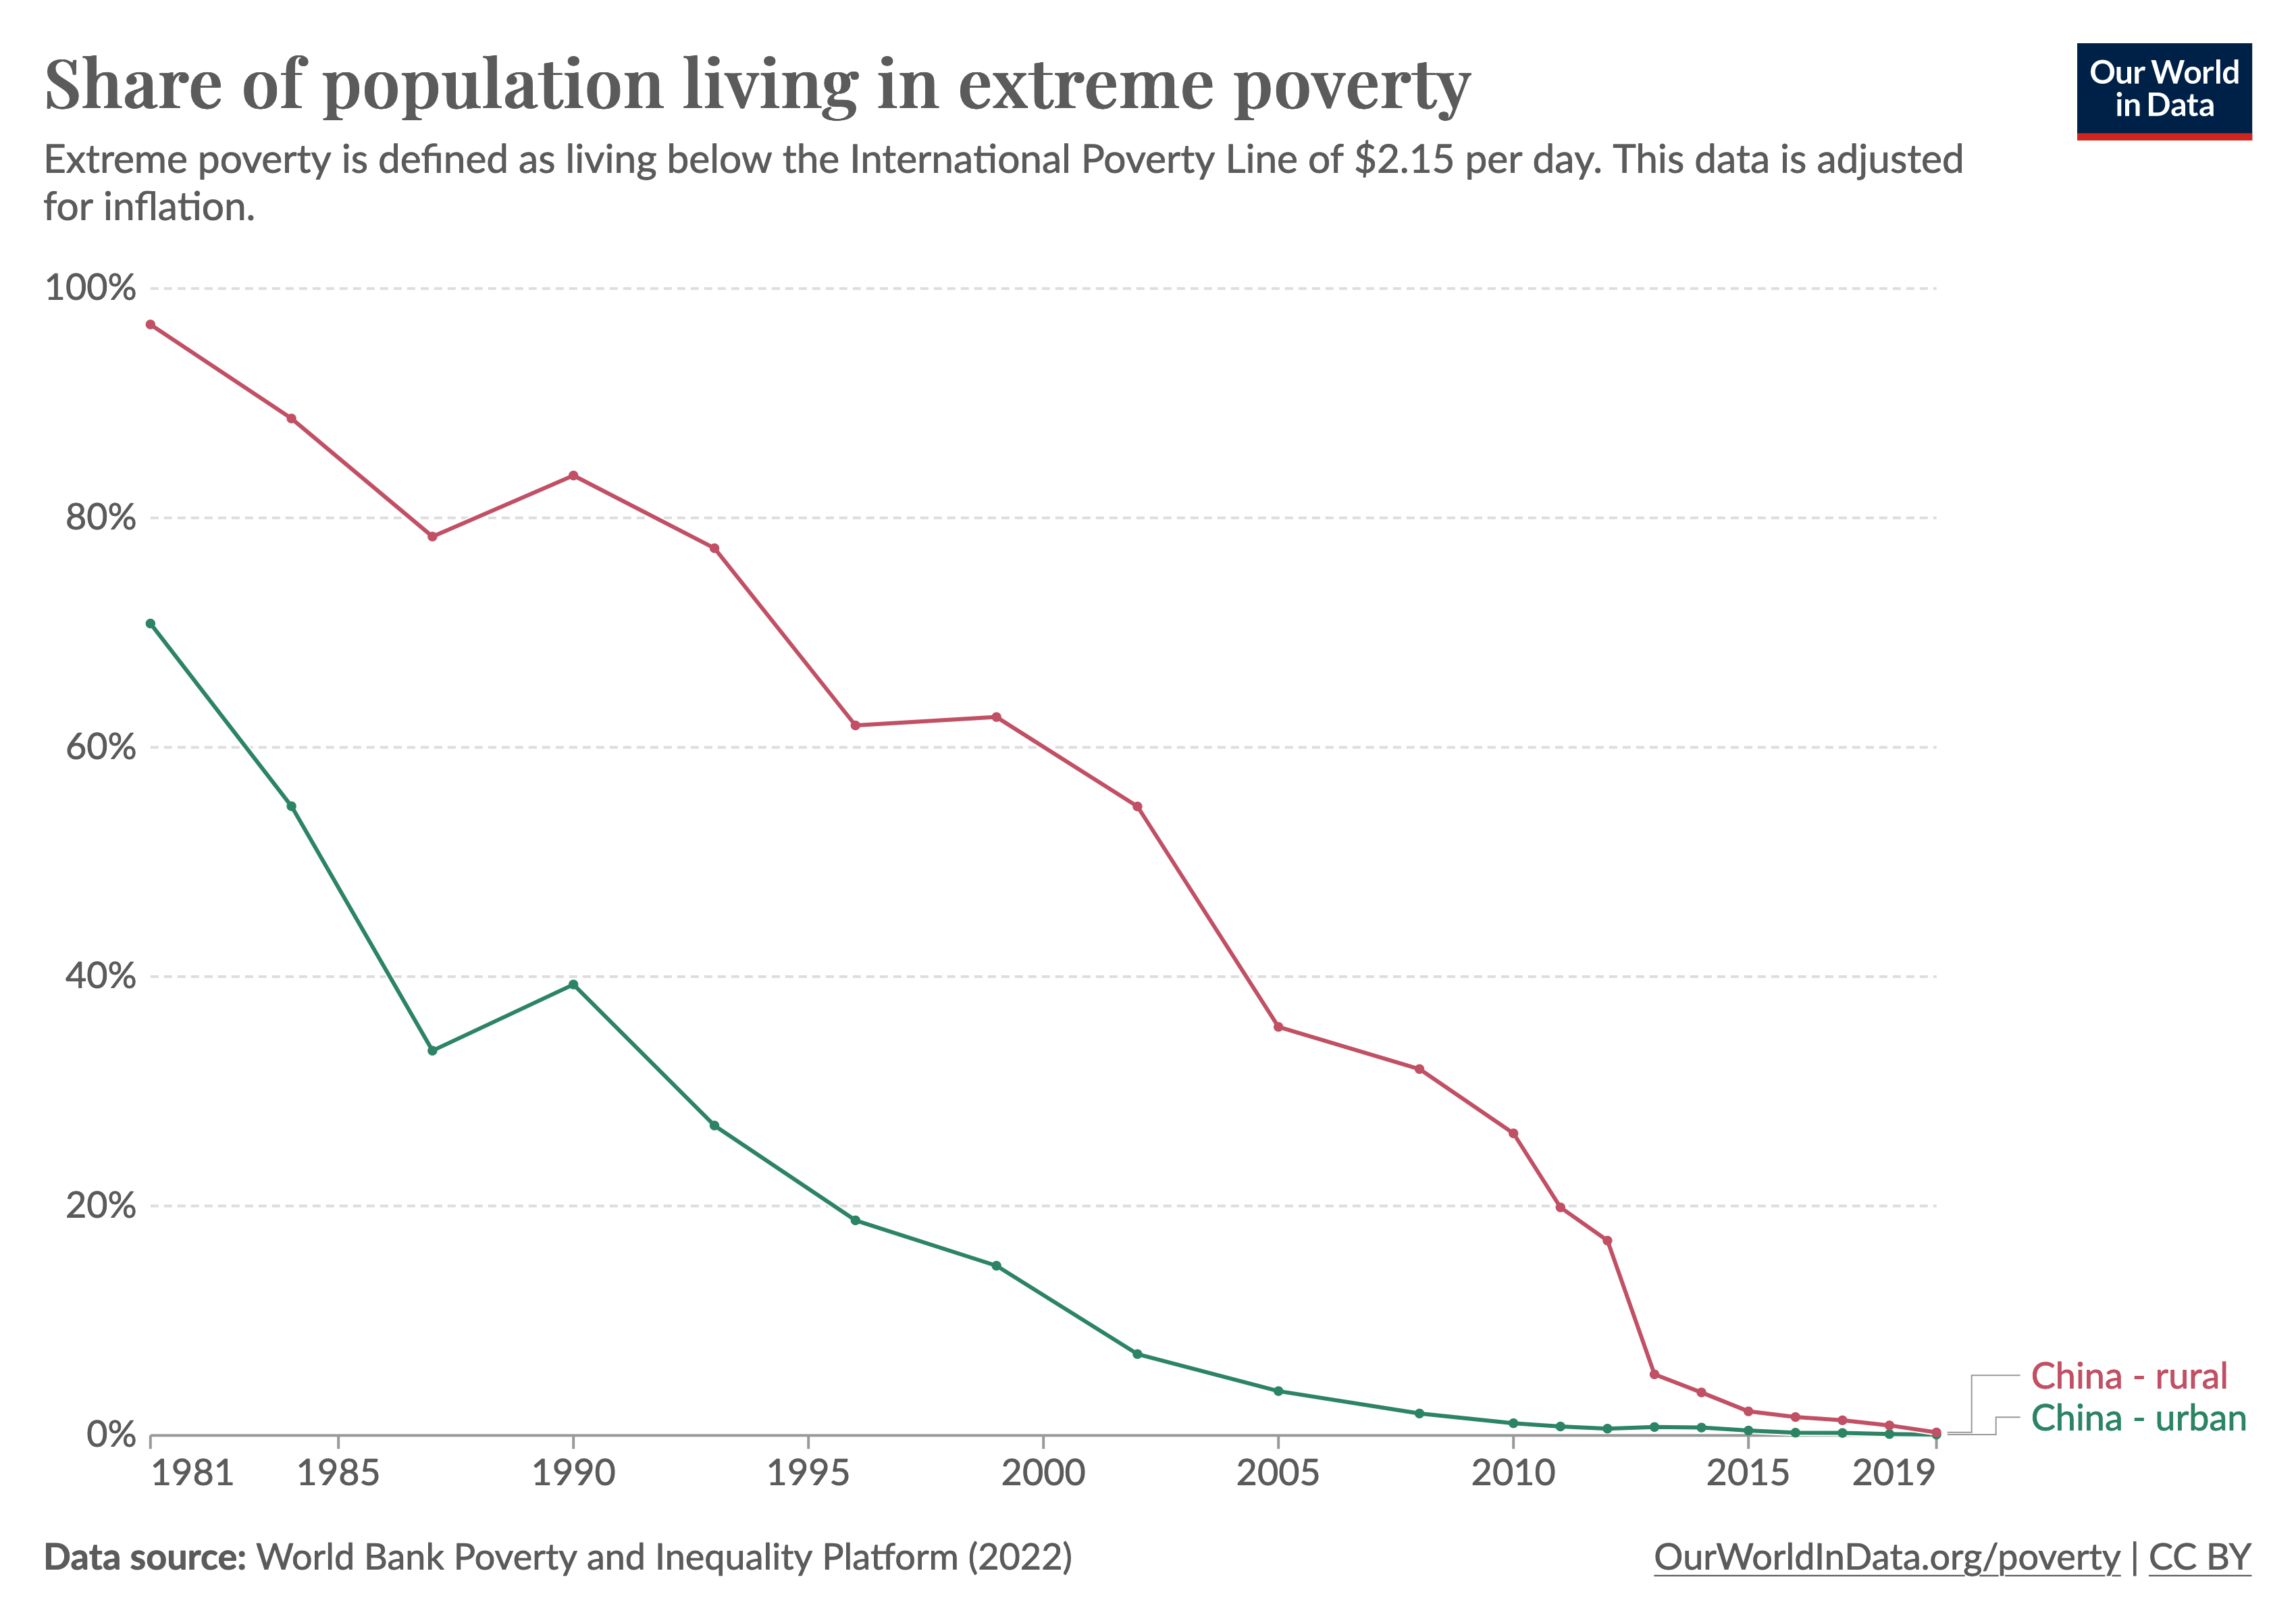
Extreme poverty in China has been almost eliminated — first in urban, then in rural regions

Extreme poverty in China has been almost eliminated — first in rural, then in urban regions

In 1981, 97% of people in the Chinese countryside lived in extreme poverty. Even in cities, it was more than 70%.

Since then, large economic growth has made it possible for hundreds of millions of people in China to leave extreme poverty behind, first in cities and then in the countryside.

By 2020, the share of people living in extreme poverty in both urban and rural areas was below 1%.

Explore this data

March 05, 2024Veronika Samborska

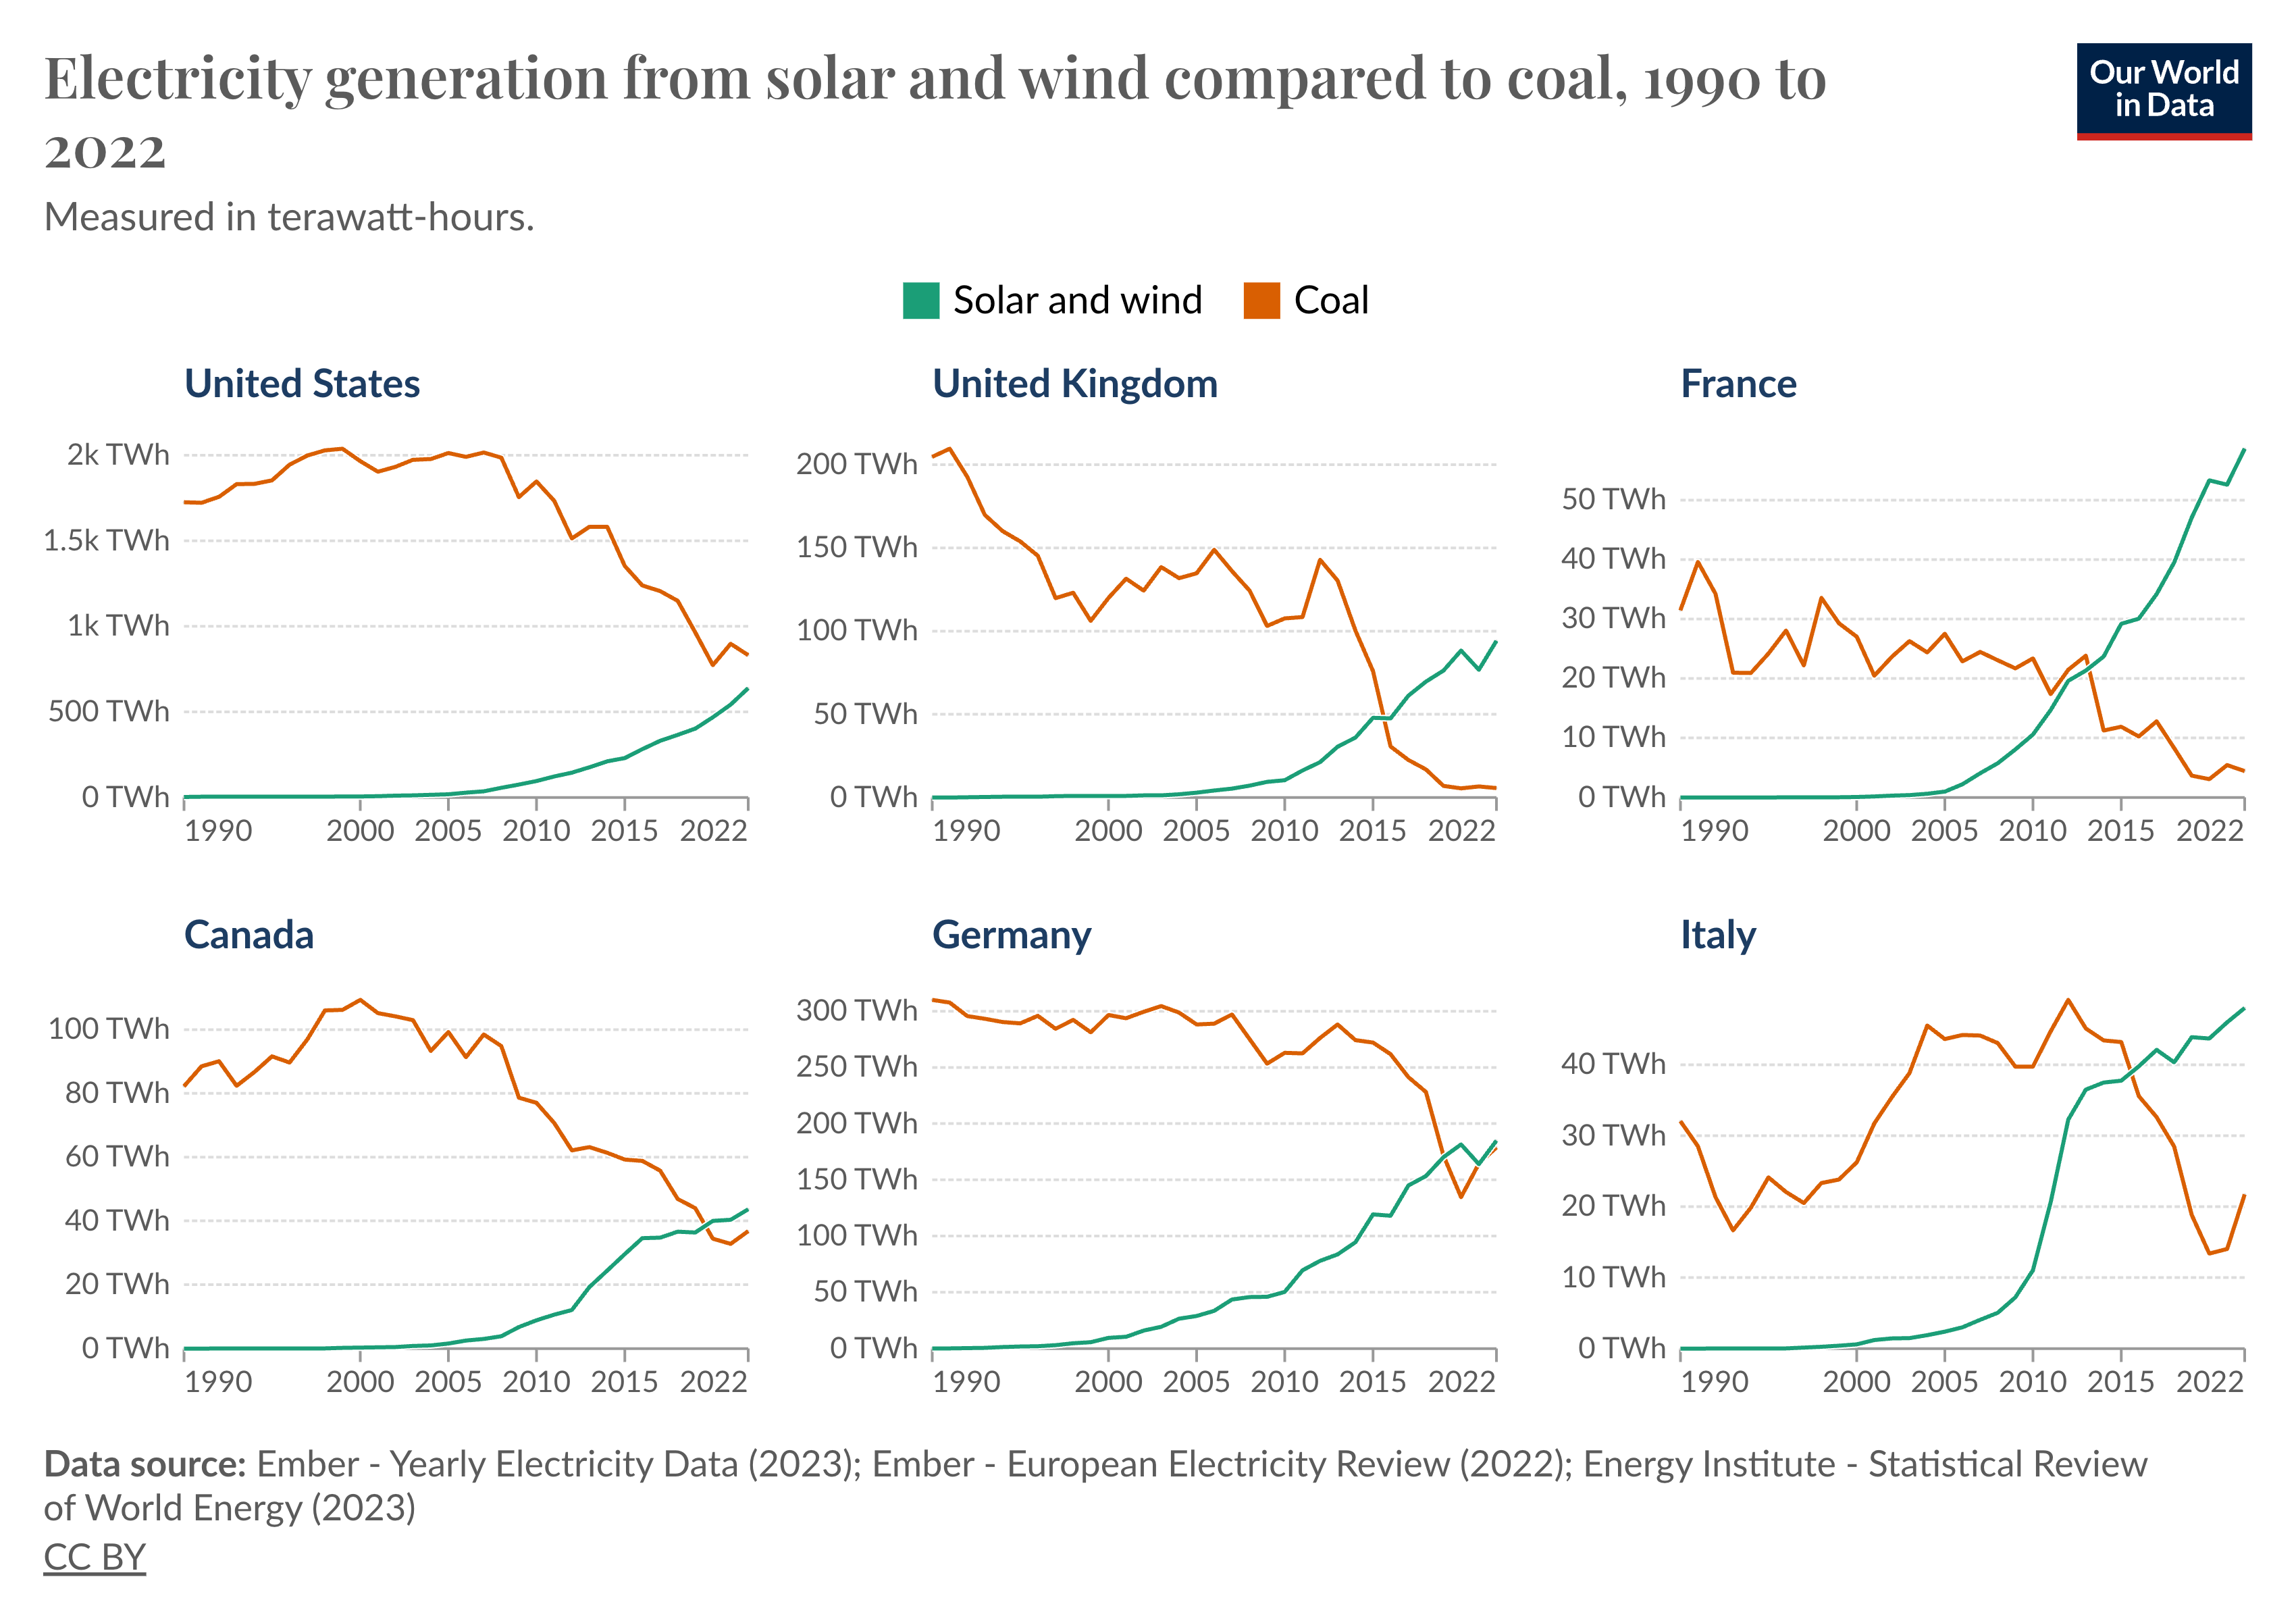
Solar and wind gain an edge over coal in a number of countries

Solar and wind gain an edge over coal in a number of countries

Solar and wind have surpassed coal as a source of electricity generation in a number of countries, as the chart shows. This marks a substantial shift towards more sustainable sources of energy.

Even in the United States, the world’s third-largest producer of coal electricity, the gap between solar and wind power, and coal is now very small. The adoption of clean energy is accelerating.

Explore this data

March 04, 2024Esteban Ortiz-Ospina

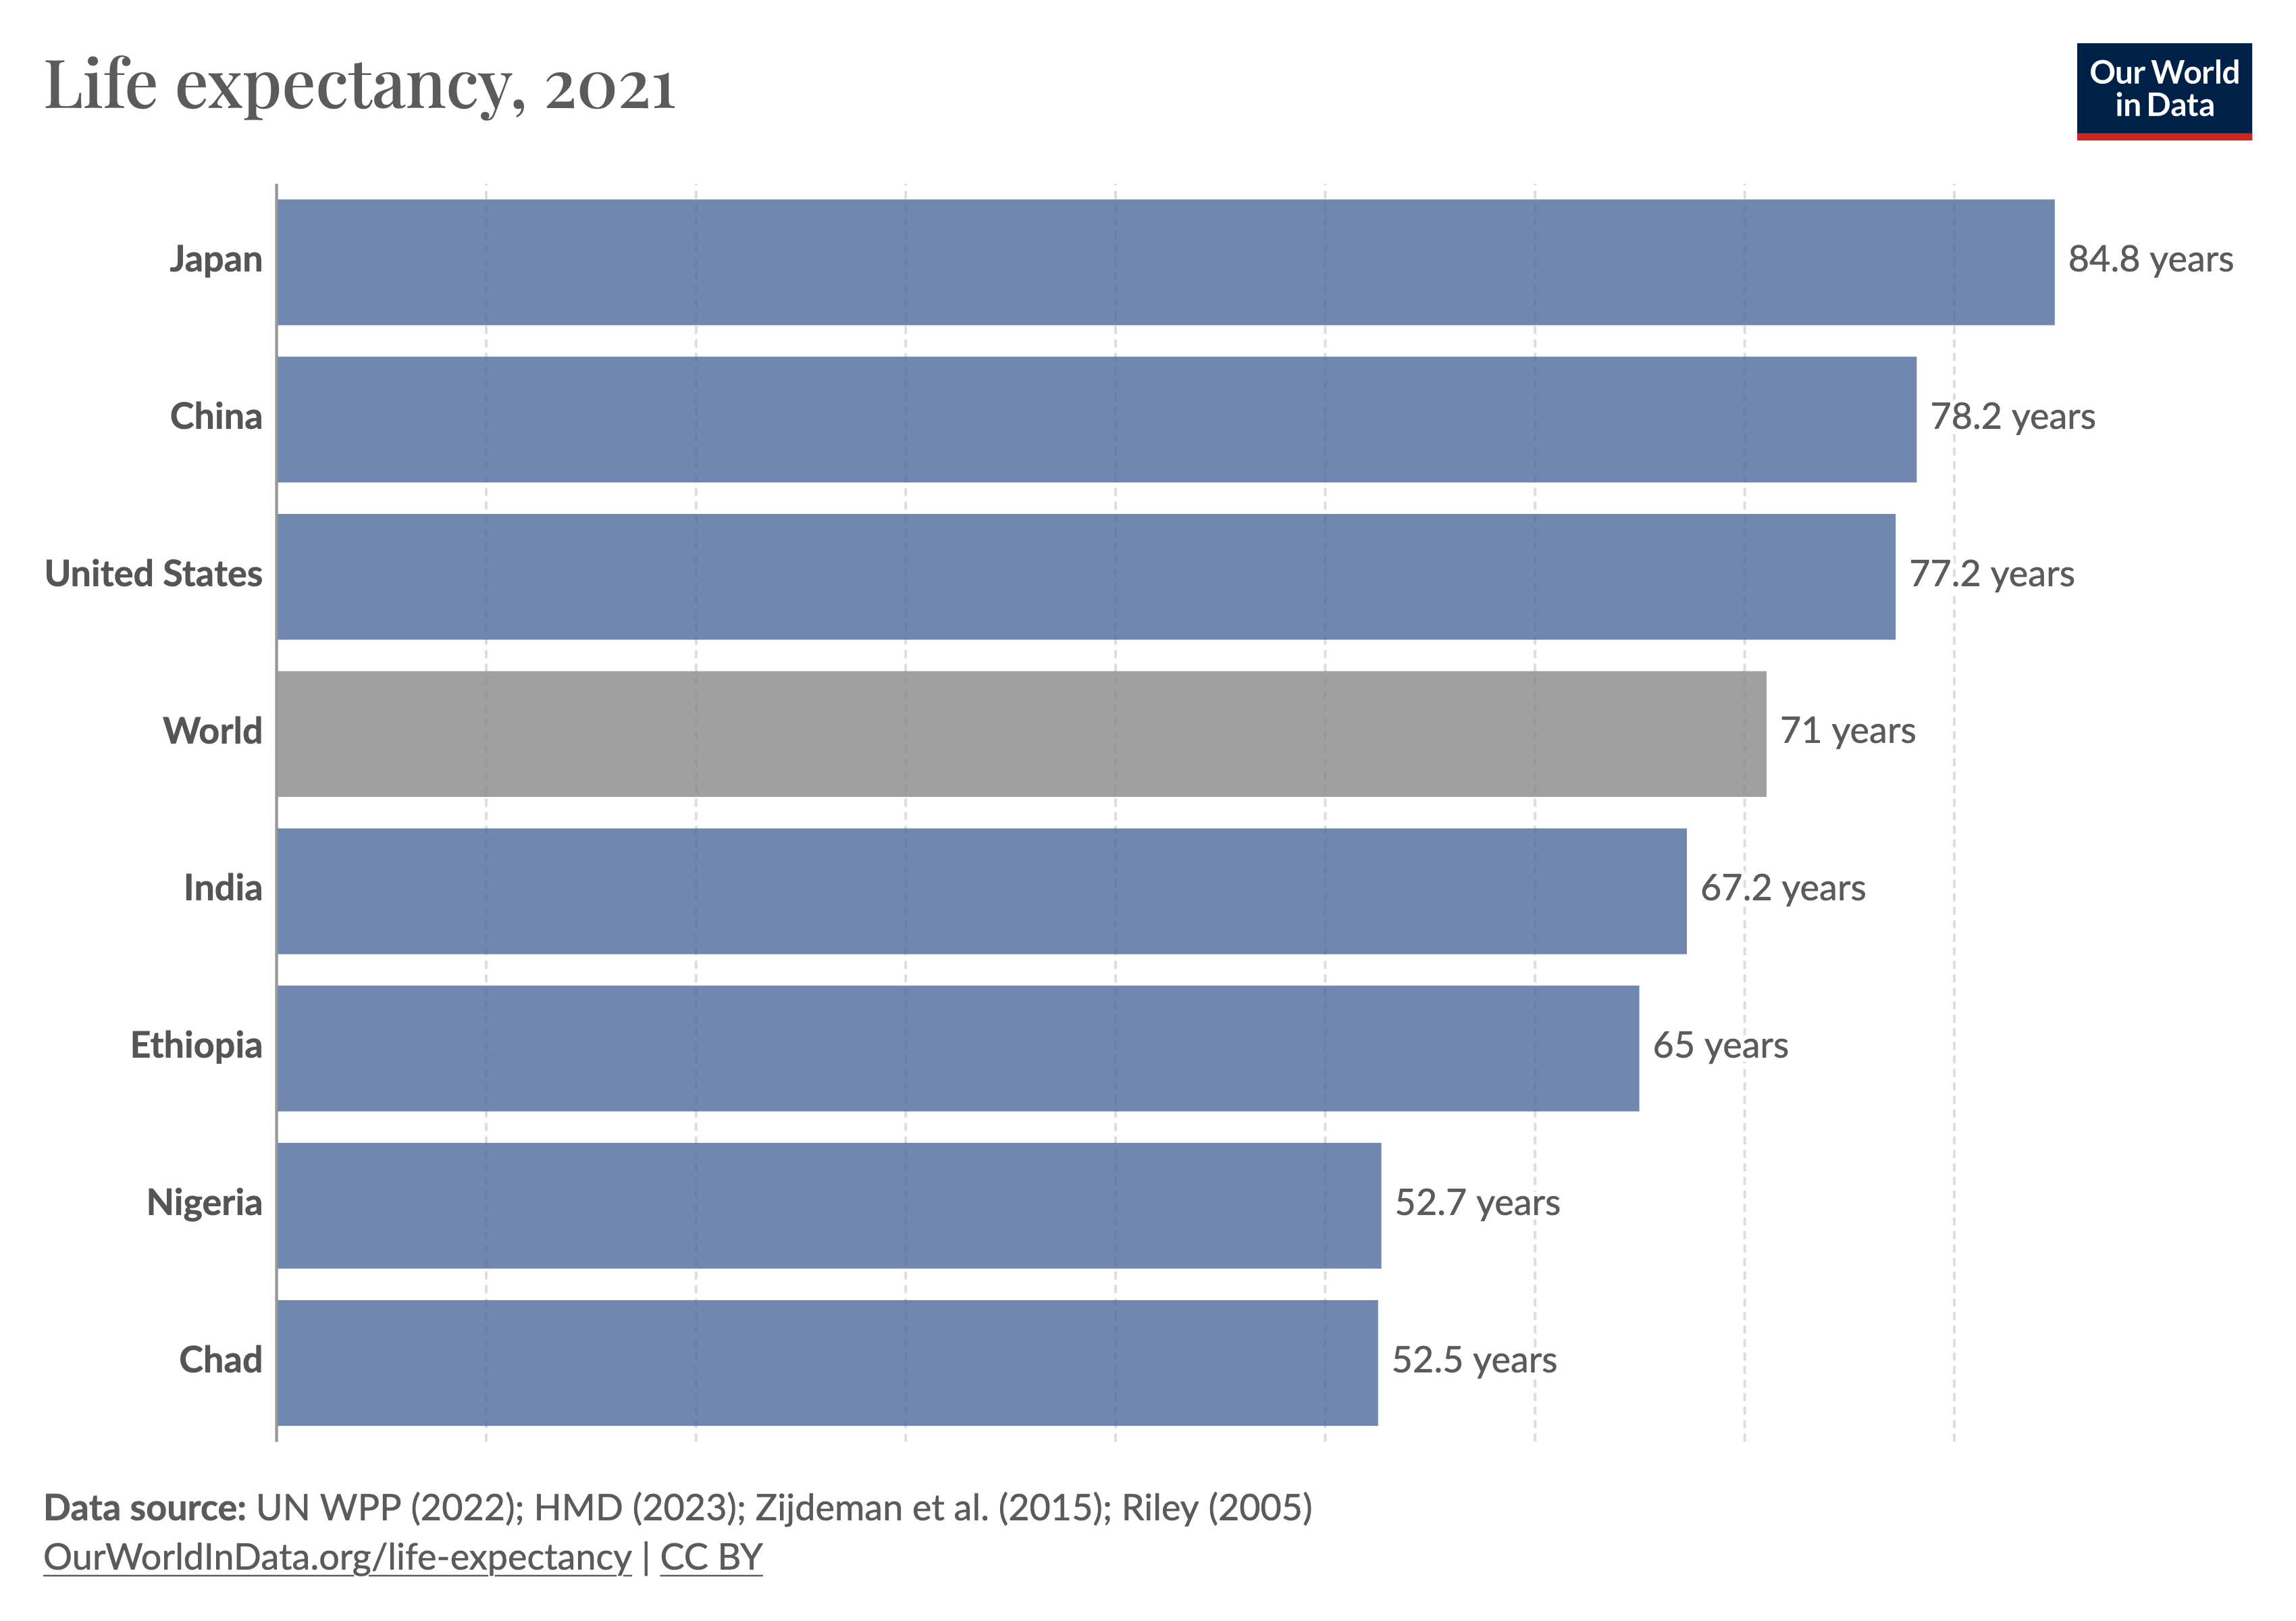
Differences in life expectancy across the world are extremely large

Differences in life expectancy across the world are extremely large

People in richer countries tend to live much longer than those in poorer countries.

We can see this in the cross-country life expectancy statistics shown on the chart. In Japan, life expectancy at birth is about 85 years, while in Chad and Nigeria, life expectancy is about 52 years — a gap of over three decades.

Explore this data

March 01, 2024Saloni Dattani

Pacemakers are crucial to people with heart rhythm disorders, but their adoption varies widely

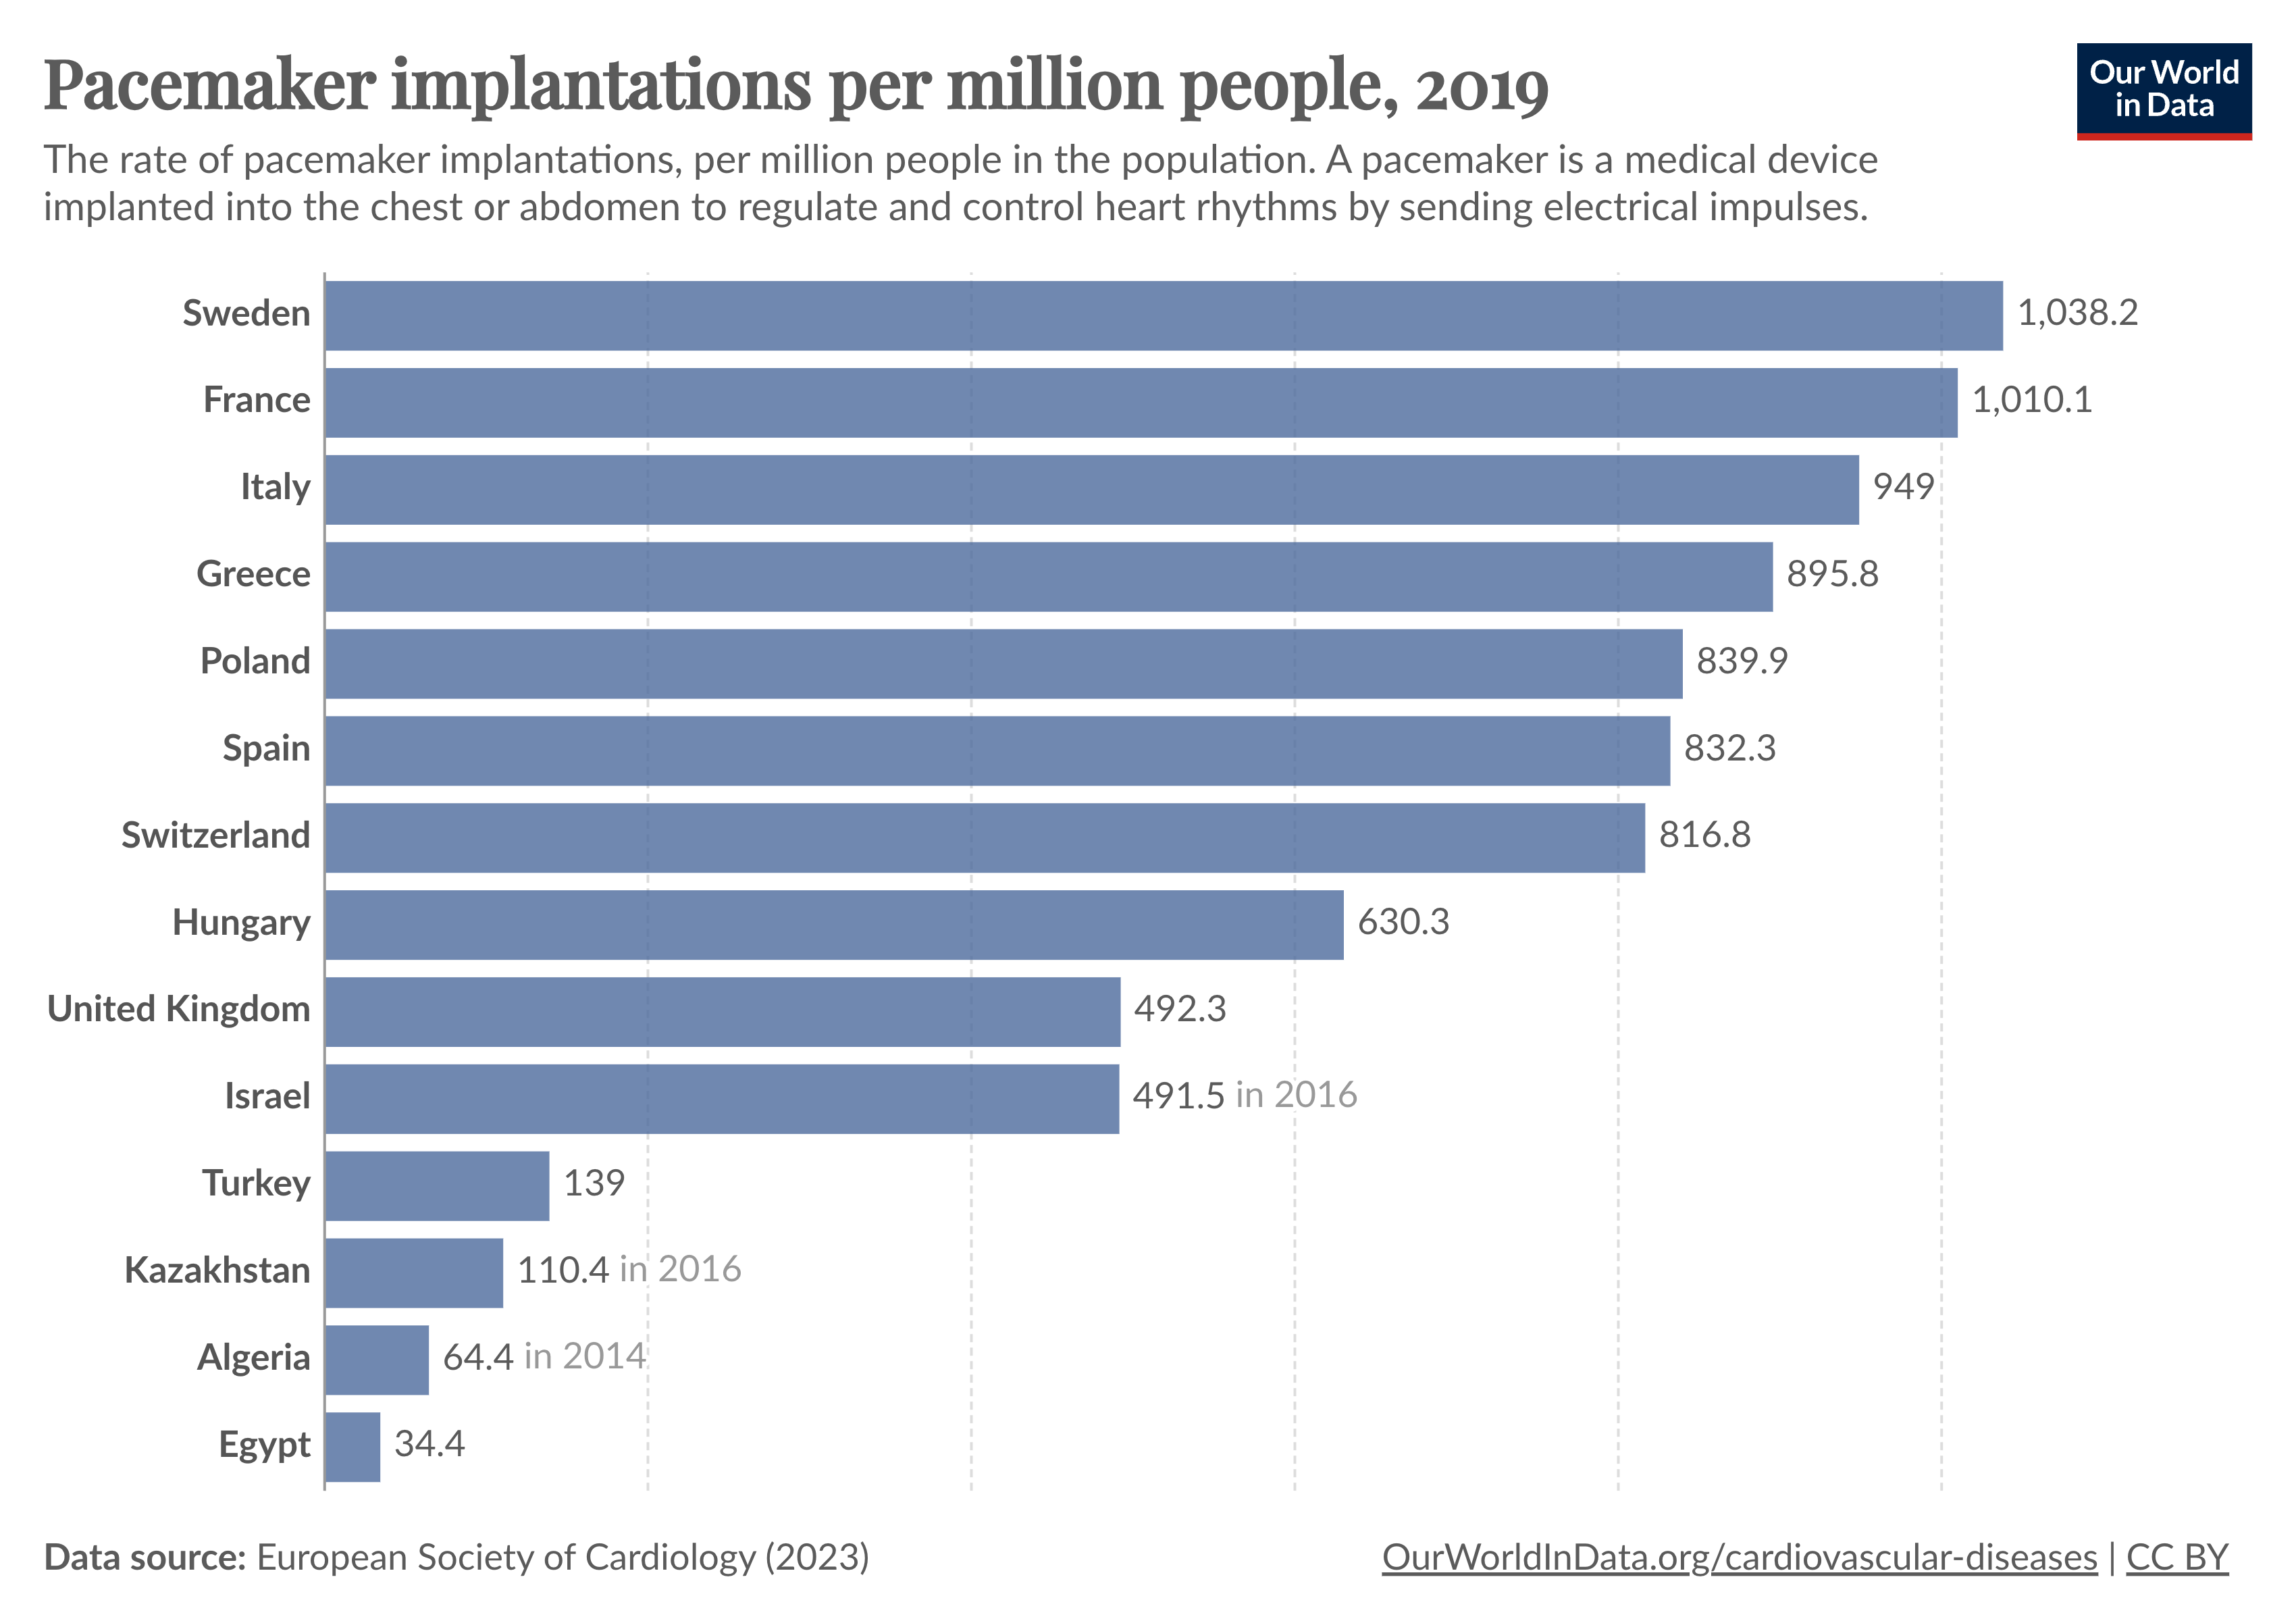
Bar chart showing the number of pacemaker implantations per million people in different countries.

Pacemakers are crucial medical devices for people with heart disorders and irregular heartbeats. They provide a steady heart rhythm and help the heart pump blood effectively to the rest of the body.

The chart shows that there are large differences in the rates of pacemaker implantations across countries.

In France and Sweden, over 1,000 per million people each year receive pacemaker implantations. In Egypt and Turkey, that figure is less than 150.

Explore this data